Blockchain 3D Explorer Review

Blockchain 3D Explorer
blockchain3d.info
Blockchain 3D Explorer (blockchain3d.info) review guide: everything you need to know + FAQ
Ever tried explaining Bitcoin to a friend and watched their eyes glaze over at the first wall of hashes and timestamps? What if you could actually see blocks and transactions appear in a 3D scene—so patterns jump out without squinting at a spreadsheet?
I test a lot of blockchain tools, and very few trigger that instant “oh, I get it” moment. Blockchain 3D Explorer does, because it turns abstract on-chain activity into something your eyes can scan and your brain can process fast. If you want a more intuitive way to spot big moves, explain confirmations to someone new, or just enjoy watching the network “breathe,” you’re in the right place.
Quick science note: our visual system is wired to notice size, color, and motion almost instantly—often in under 250ms. That’s called preattentive processing, and it’s why a good visualization can beat a table for pattern-spotting.
Where most explorers fall short
Traditional blockchain explorers are great at accuracy, not so great at clarity. They often feel like accounting software—dense, static, and intimidating for newcomers. Even if you’re experienced, it’s slow to connect the dots.
- Relationships are invisible: You see a txid and a list of inputs/outputs, but not the flow or scale at a glance.
- Context is hard: Is this block big or small for the hour? Are fees spiking? From a table alone, it’s not obvious.
- Teaching is tough: Showing a beginner “mempool pressure” or “confirmations” with a static page is a struggle.
- Pattern spotting is slow: When market news hits, bursts of transactions, full blocks, and fee jumps are easier to feel than to read.
Real example: during a fee surge, a 2D list just shows “more stuff.” A 3D scene can make block fullness, transaction clumps, and confirmation progress pop instantly—no mental gymnastics required.
What I’m going to show you
Here’s the plan. I’ll walk through how Blockchain 3D Explorer turns blocks and transactions into a navigable 3D world you can move through, what you can learn at a glance, and where it clearly beats the usual 2D list. I’ll also call out the limits so you don’t expect a full-blown analytics suite. To keep things practical, I’ll share setup tips, performance tweaks, privacy basics, and straight answers to common questions.
Who this guide is for
- Beginners who want that quick “aha” moment without reading a manual.
- Teachers and presenters who need a live, visual way to explain blocks, mempools, and confirmations.
- Analysts who think visually and want fast intuition before deep querying elsewhere.
- Curious observers who enjoy watching network activity in a more engaging format.
What you’ll get out of this
- How the tool works and the controls you’ll actually use.
- Where it shines vs. where it doesn’t, so you pick the right tool for the job.
- Real workflows for teaching, tracking a tx/address, and monitoring live activity.
- Pros, cons, and a no-nonsense verdict so you can decide fast.
Curious what a “3D blockchain explorer” actually looks like in action—and why it can feel so much clearer than a wall of txids? Let’s take a look at what it is and when you’d use it next.
What is Blockchain 3D Explorer and why use it?
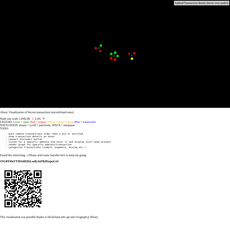
Blockchain 3D Explorer is a live, browser-based way to see the blockchain as a moving 3D scene — blocks, transactions, and flows rendered as shapes you can orbit around, zoom into, and understand at a glance. Think of it as a visual layer on top of on-chain data, not a full analytics suite. You won’t get heavy tagging, CSV exports, or forensic labels here. You will get a fast, intuitive view of what’s happening right now (or at any block in history) that makes patterns jump out.
“When you can see it, you can explain it.”
Why use it? Because some questions are visual by nature. How full is this block? Which transactions look massive relative to the rest? Did activity just spike after a price move? In 2D tables, those answers hide in rows and columns. In 3D, they pop — thanks to size, color, and motion that our brains pick up quickly. Research in information visualization shows that preattentive cues like size, color, and movement help us spot outliers and patterns far faster than reading numbers one by one (see Ware, “Information Visualization,” 2013).
How it works in simple terms
Here’s the idea in plain English:
- Blocks as objects: Each block appears as a 3D object (often a cube or pillar). Its size can reflect how full it is; color can reflect average fee rate or another metric.
- Transactions as nodes: Transactions are smaller shapes around or within blocks. Big transfers look bigger; fee tiers or confirmation states can change their color or glow.
- Connections as links: Inputs and outputs can show up as lines, arcs, or spatial groupings. It’s an immediate sense of “this tx fed into that block” or “these UTXOs fan out.”
- Live or historical: Watch the mempool (pending transactions) flow into the next block in real time, or jump to a specific height/txid and replay the moment. For example, load block 840,000 (the 2024 halving block) and instantly grasp how it compares in size and fee pressure.
- Data sources: The app typically pulls from a node or public APIs (e.g., common explorer/fee endpoints). Exact sources can vary; the site often indicates where it’s fetching data from so you can assess freshness.
In practice, I might paste a txid, watch the camera center on it, and then see which block it landed in, how crowded that block was, and whether similar transactions clustered around a fee band. It turns “what’s going on?” into “oh, that’s what’s going on.”
Who it’s best for
- Beginners who want the blockchain to finally “click.” If text explorers feel like spreadsheets, this turns them into a living map.
- Teachers and presenters who need to explain confirmations, block space, or fee competition without losing the room.
- Visual thinkers and analysts who like to spot anomalies fast, then switch to heavier tools for deep research.
It’s less ideal if you primarily want:
- Dense tables with sortable columns and dozens of filters
- Attribution/tagging (exchanges, services, clusters)
- Exports and forensics (CSV, address clustering, heuristics)
Use this as your radar, not your entire toolkit.
Supported networks and scope
The focus is commonly Bitcoin mainnet. Depending on the current build, you may see options for testnet or additional chains, but expect Bitcoin to be the core experience. Typical actions include:
- Search by block height/hash: Jump straight to a block and see its contents as a 3D snapshot.
- Search by txid: Center the transaction, understand its context, and see where it confirmed.
- Search by address: View transactions related to that address and how they sit within blocks (keep in mind, no deep labeling).
What you likely won’t find: advanced tagging, AML-style metadata, or chain heuristics you’d expect from specialized analytics platforms. This is about clarity and engagement, not attribution or investigative depth.
Want to try it without frustration or lag? I’ll show you the smoothest setup, the right browser/GPU settings, and a 60-second first-run walk-through next. Ready to see your first block render in 3D right in your browser?
Getting started: setup, requirements, and first run
There’s a moment when you load a 3D blockchain and your brain goes, “Oh—this is how blocks, fees, and confirmations actually feel.” If you want that moment fast, here’s the smoothest way to open blockchain3d.info, avoid hiccups, and get to your first meaningful view without fighting your computer.
“Clarity beats complexity.” When the visuals click, the learning curve collapses.
Device and browser requirements
3D on the web is powered by your browser and GPU. Treat it like a lightweight game: it’ll run on most modern machines, but it loves a decent graphics chip and hardware acceleration.
- Browser: The latest Chrome, Firefox, Edge, or Safari with WebGL enabled. Quick checks:
- Test WebGL: get.webgl.org
- Inspect capabilities: webglreport.com
- WebGL2 support map: caniuse.com/webgl2
- Hardware acceleration: Make sure it’s on. In Chrome, it’s under Settings → System → “Use hardware acceleration when available.” Google notes that hardware acceleration offloads graphics work to your GPU and can significantly improve rendering performance in visual apps (see general guidance in Chrome Help).
- CPU/GPU: Any 4-core CPU and integrated graphics from the last few years is usually fine. Discrete GPUs make it smoother, especially in live scenes with lots of transactions.
- RAM: 8 GB or more is comfortable if you like keeping multiple tabs and tools open.
- Internet: Stable connection for live updates; wired or strong Wi‑Fi helps during busy network periods.
- Mobile vs. desktop: It can run on modern phones/tablets, but desktop is noticeably smoother and easier to control. iOS Safari may limit intensive WebGL scenes in the background.
Tip: If the page loads but the canvas is blank, it’s almost always a WebGL or hardware acceleration issue. The quick fix is to enable acceleration, restart the browser, and reload.
First 60 seconds walkthrough
Here’s the fastest way to go from zero to “aha.”
- Step 1: Open the site. Head to blockchain3d.info. Give it a second to initialize the 3D canvas.
- Step 2: Spot the controls. You’ll usually see a control panel or a small toolbar (often top or side). Look for a search bar, a settings/gear icon, and a play/pause toggle for live data.
- Step 3: Try a quick search. Paste a txid, address, or block hash. After hitting enter, the scene typically centers or highlights the relevant objects so you can orient instantly.
- Step 4: Toggle live view. Switch to live/mempool mode if available. You should see new transactions animate in and blocks materialize as they’re found.
- Step 5: Set quality. Click the gear/settings icon and pick a quality preset that keeps motion smooth on your machine (Medium is a safe starting point).
- Step 6: Hover for tooltips. Hovering or clicking objects usually shows details (size, time, fees). That tiny peek saves a trip back to a 2D explorer when you’re just getting context.
Real-world nudge: If you’re new, searching a known “whale” transaction or your own small test transfer makes the structure feel real. Watch it move from mempool to a block—seeing the confirmation visually is more intuitive than any table.
Performance and accessibility tips
Not all devices love a busy mempool. If your machine stutters or if motion makes you queasy, these tweaks help a lot.
- Reduce what’s on screen:
- Lower quality or level of detail in settings.
- Turn off shadows, bloom, or heavy anti‑aliasing if those options exist.
- Limit visible blocks or mempool depth (fewer concurrent objects = smoother render).
- Pause live view when you’re inspecting and resume when you want motion back.
- Make motion comfortable:
- Lower camera sensitivity and inertia to reduce “floatiness.”
- Use a mouse over a trackpad for steadier control.
- If your OS has “Reduce Motion” enabled, many modern web UIs respect it via the prefers-reduced-motion media query. Designers use it to avoid animations that can trigger discomfort; see MDN’s guidance: prefers-reduced-motion. Nielsen Norman Group also notes that limiting non-essential motion helps users with vestibular disorders and improves overall usability for everyone (NN/g on animation & usability).
- Tame the network flood:
- During busy periods, switch to historical view and scrub around specific blocks instead of staying live.
- If you run privacy extensions, whitelist the site if live data looks stuck—some block WebSocket/API calls needed for updates.
- Browser sanity checks:
- Close tab-heavy sessions to free RAM.
- Update your GPU drivers (Windows) or keep macOS up to date—WebGL performance often rides on driver quality.
- Try another browser if you hit a rendering quirk; WebGL implementations can vary by vendor.
- Visual clarity:
- If there’s a theme or contrast toggle, pick a higher-contrast palette so blocks and transactions stand out at a glance.
- Zoom in until labels/tooltips are legible; don’t fight tiny text.
Once you’re set up and comfortable, the magic is in how you move and read the scene. Want to know the exact orbit, pan, and zoom tricks I use so you never get “lost” in space—and how to read the color legend like a pro without second-guessing yourself?
Core features and controls you’ll actually use
3D makes blockchains feel alive—when you can actually control the scene. Here’s how to steer Blockchain 3D Explorer so it’s not just eye candy, but a real instrument you can read in seconds.
“Above all else, show the data.” — Edward Tufte
Camera and navigation
Think of the camera like your hand on a globe. You’re not just looking—you’re flying around the network. On most builds, these basics work right away:
- Orbit: Click and drag (left mouse). Circle around a block, keep it in frame.
- Pan: Right-click drag or hold Shift/Alt + drag. Slide the whole scene without rotating.
- Zoom: Mouse wheel or trackpad pinch. Small steps are smoother than big jumps.
- Focus: Double-click an object or use a context button like “Center/Focus” after selecting a block/tx.
- Reset: Look for a “Reset View” or press R (common shortcut) to snap back when you lose orientation.
Practical tip that saves time: orbit until the object’s silhouette is clean, then zoom. If you zoom first, you’ll over-rotate and lose it. Another simple trick—keep the “ground plane” or axis grid (if available) visible. Your brain anchors to a horizon line, which reduces motion confusion and makes it easier to compare block sizes from a consistent angle.
Why this matters: research on visual perception shows our eyes are fast at picking up relative size and position—especially when the scene is stable. That quick “is this bigger or smaller than the last one?” judgment is the backbone of spotting fee spikes and fat blocks. If you want a refresher on why this works, check preattentive attributes in visualization from the Nielsen Norman Group: preattentive visual properties.
Blocks, transactions, and colors/legends
Blockchain 3D Explorer turns abstract records into shapes you can read at a glance:
- Blocks: Typically larger, solid shapes. Height or volume often maps to size/weight (vBytes) or transaction count. Big block = busy block. A series of similarly tall blocks = sustained high throughput.
- Transactions: Smaller nodes, points, or “bubbles” clustered around their parent block or floating in the mempool layer. Clustering and density hint at how packed the block is.
- Edges/links (if shown): Thin connectors may represent flows or relationships between inputs and outputs, helping you see fan-in/fan-out patterns without reading a table.
- Colors: Palettes usually encode status or fee pressure—cooler tones for lower-fee/low-priority, warmer tones for higher-fee/high-priority. Some explorers also use distinct hues for unconfirmed vs. confirmed.
- Legend: Find the legend toggle. It’s your Rosetta stone for “what does this color/size mean right now?” If the palette is fee-based, you’ll see bands (e.g., 1–5 sat/vB, 6–20, 21–50, 50+). If it’s status-based, you’ll see unconfirmed/confirmed states spelled out.
Real-world read: if you notice a run of warm-color transactions funneling into the next block, expect a short-term fee race. When the color mix cools and block heights shrink, it often signals mempool relief. Watching this “heat” change across two or three blocks can sometimes tell you more in five seconds than a minute of scrolling a 2D list.
Search and filtering
The magic happens when you combine searching with camera focus. Typical flow:
- Search box: Paste a txid, address, block hash, or block height. Hit Enter.
- Focus: The scene should center on your result or highlight it. If not, click the result list item, then use the “Focus/Center” button.
- Context: With the target centered, zoom out slightly to see neighbors—other tx in the block, or the block’s position among nearby blocks.
If you’re tracking something specific, a little noise control goes a long way. Where available, look for:
- Visibility toggles: Hide unconfirmed, hide low-fee bands, or hide tiny transactions.
- Minimum value sliders: Only show transactions above a threshold (e.g., filter dust).
- Edge density: Limit or switch off link lines to reduce clutter while you navigate.
Quick example you can try right now: grab a txid from any recent block on a 2D explorer (like mempool.space), paste it into blockchain3d.info, center the camera, and take two steps back with the zoom. You’ll immediately see how “busy” that block is and where your transaction sits in the queue relative to neighbors—context that’s hard to feel in a table.
Live mode and playback
This is the heartbeat. Watching the mempool and chain in real time is why people fall in love with a 3D explorer.
- Live toggle: Switch to live to see transactions pouring in and blocks materializing. It’s mesmerizing, but more than that—it’s signal.
- Pause/resume: Hit pause when something interesting happens (e.g., a sudden cluster of high-fee tx). Rotate and inspect without the scene moving.
- Timeline/scrub (if provided): Drag back a few minutes to replay the moment a block hit and the mempool thinned. Great for comparing “before vs. after” at a glance.
- Speed control: Some builds let you slow down the flow. Use it when explaining confirmations to a group or when you’re annotating a screen recording.
- Snapshot/share: If there’s a shareable URL or scene snapshot, bookmark it. You can return to the same perspective during a presentation.
One small but powerful habit: when the market is volatile, keep live mode on a second monitor or a side window. You’ll start recognizing “visual signatures” of congestion: thicker clusters, warmer fee colors, and a “rush” of transactions right after major news. It’s the kind of pattern your eyes pick up faster than your conscious brain—exactly what 3D is good at.
Why the visuals work: a long line of research in visualization and human-computer interaction points to faster pattern detection when size and color carry meaning. If you want to nerd out, Shneiderman’s “overview first, zoom and filter, then details-on-demand” pattern is basically how this tool invites you to use it—an approach that keeps you fast without losing depth. A classic reference: Visual Information-Seeking Mantra.
Now that you know how to move, read, and control the scene, want to see how I use these buttons to trail a suspicious transaction or explain confirmations to a room in under 60 seconds? In the next section, I’ll walk through real workflows—step by step, with examples you can copy.
Practical workflows: from wow‑factor to real insights
Cool visuals are great, but I use Blockchain 3D Explorer to actually get signal. Here are the exact workflows that turn the 3D scene into fast, useful insights—without needing a PhD or 20 tabs of SQL.
"Seeing is understanding. Once you see it, you can’t unsee it."
Follow an address or transaction
When someone pings me a TXID or I need to sanity‑check activity around an address, I use the 3D view to orient myself instantly.
- Paste the TXID or address: Use the search bar on blockchain3d.info and hit Enter.
- Center and lock the camera: Click the result so the scene “snaps” to it. If there’s a focus/center button, use it to keep the object in view as you orbit.
- Read the shape:
- One input → many similar outputs: Often an exchange payout batch. It looks like a dandelion head—one stem, lots of evenly sized seeds.
- Many inputs → one or two outputs: Likely a wallet consolidation. Think broom sweeping dust into a single pile.
- Repeating one‑to‑one hops with change: A “peel chain”—a thread of sequential sends, usually small skims off a bigger pot.
- Use color/size cues: Larger objects often hint at bigger values or more weight; color frequently maps to fees or status (unconfirmed vs. confirmed). Hover if tooltips show sats/vB or sizes.
- Branch outward, but don’t get lost: Follow one hop at a time; if filters exist, hide unrelated clutter to keep your working memory free. Visual cognition research shows we process preattentive cues like size and color almost instantly (NN/g).
Why this works: patterns that take minutes to piece together in 2D tables pop out in seconds in 3D. There’s solid evidence that memorable, well‑coded visuals improve recall and comprehension (Borkin et al., IEEE TVCG).
Teaching and presentations
I love using the 3D scene to explain the basics in a way that sticks. No jargon. Just motion and scale doing the heavy lifting.
- Show confirmations: Start with an unconfirmed transaction floating in the scene. When a block lands, point to how it “locks in” and how the same TX gains confirmations over time.
- Visualize block size and capacity: Compare a near‑empty block vs. a packed one. The dense block “feels” heavier—people grasp limited block space without a single slide of text.
- Explain the fee race: Highlight how higher‑fee transactions are visually distinct (often brighter/different color) and tend to settle earlier. Keep a lower‑fee TX on screen and let the room watch it wait its turn.
- Pro demo setup:
- Preload a few known moments (a bursty block, a quiet block, a big consolidation).
- Limit camera movement—slow pans, no jerky spins. Animated transitions help audiences track changes (Heer & Robertson).
- If anyone gets motion‑sensitive, reduce quality/complexity so the scene is calmer.
Tip: Use a simple script—“What happens before a block? How do fees compete? Why do confirmations matter?” Answer each with a 20‑second visual moment.
Monitoring live network activity
During busy periods—ETF headlines, exchange incidents, inscriptions surges—I keep the live view open like a heartbeat monitor.
- Switch to live mode: Turn on real‑time mempool/chain if available. Keep fee color‑coding on.
- Watch for bursts: A sudden bloom of high‑fee TXs suggests pressure. When blocks are full back‑to‑back, expect a fee climb. This lines up with fee‑market behavior documented by mempool researchers (mempool.space FAQ).
- Pair with price alerts: I keep a price chart on the side. Congestion doesn’t predict price, but spikes in on‑chain demand often co‑occur with volatility events (Coin Metrics research regularly explores these dynamics).
- Quick fee sanity check: After a big block confirms, eyeball what’s left in the mempool. If it’s still packed with high‑fee TXs, the next block likely won’t be cheap.
Pro tip: If your machine stutters in heavy moments, reduce visual detail or pause the scene briefly, then resume. You’ll still spot the patterns without choppy playback.
Light exploration for analysts
Before I open heavier tools, I do a 3D “scan” to triage what deserves deeper work. It’s fast and surprisingly effective.
- Flag behaviors at a glance:
- Batch payouts: One TX with dozens or hundreds of tidy, similar outputs.
- Consolidations: A whale sweeping many small inputs into one or two outputs (often off‑peak for lower fees).
- Dusting patterns: Lots of tiny outputs fanning out—possible dusting activity (background on dusting).
- Peel chains: Linear sequences with consistent change behavior—look like beads on a string.
- Time your deeper analysis: If something looks non‑standard, grab the TXID/block and confirm details in a 2D explorer with richer labeling, tags, or heuristics.
- Story framing: For reports or threads, screen‑capture the moment a block lands or a batch fires. The still shot alone often “sells” the narrative better than a wall of text.
Why this works: our brains are tuned to spot shape, motion, and repetition faster than we parse tables. This lowers cognitive load and speeds triage, especially when you don’t know what you’re looking for yet.
So here’s the real question I always get: where does this 3D approach absolutely shine, and where does it fall flat compared to a traditional explorer? Let’s talk strengths, weaknesses, and a few surprises next.
Pros, cons, and what surprised me
What it does really well
When I first spun the camera around a fresh block, I had that “ohhh” moment. It’s the difference between reading about a traffic jam and watching it from a helicopter. Patterns snap into view fast, and that matters.
- Instant sense of scale: You feel the size and cadence of blocks and transactions. During the 2024 halving weekend, it was obvious when blocks started landing back-to-back with little breathing room—no charts needed to tell me the network was busy.
- Great for storytelling: Teaching confirmations, mempool backlog, or fee pressure is so much easier when you can point and say, “See that? That’s what a full block looks like.” Research on multimedia learning suggests visuals improve understanding and recall (Mayer, 2009).
- Pattern spotting at a glance: Sudden bursts of transactions linking around a single time window pop out in 3D. Think of those evening periods when fees spike—seeing clusters converge tells me to double-check if a market move just hit.
- Engagement that actually sticks: I’ve watched non-technical folks lean in and ask better questions after 30 seconds in the scene. The visual “hook” matters when you’re trying to make Bitcoin less abstract.
- Spatial memory boost: It’s easier to remember “that big block followed by a quiet one” than a list of hashes. Humans are wired to recognize shapes and scenes; 3D leans into that.
“Seeing is understanding. The moment the data becomes a scene, it turns into a story.”
Where it falls short
3D isn’t a free upgrade across the board. There are trade-offs, and if you expect a forensic toolkit, you’ll bump into limits fast.
- Precision is harder in 3D: If you need exact comparisons or micro differences, classic charts and tables still win. Decades of research shows 3D and animation can reduce precise reading (Kosara; Heer & Robertson, 2007). The 3D scene is fantastic for context, not surgical measurement.
- Limited labeling and attribution: You won’t get deep entity tagging, clustering heuristics, or rich metadata you might expect from specialized analytics suites. It’s a visualization layer, not Chainalysis.
- Fewer heavy filters: You can search and focus, but multi-step queries, entity pivots, or CSV exports aren’t the forte here. When I need to track fee tiers across hours or run address heuristics, I jump back to a classic 2D explorer or analytics tool.
- Hardware and browser dependency: WebGL and a decent GPU help a lot. On an older ultrabook, I’ve seen stutter when too many objects are on screen. The fix is simple—reduce quality or object count—but it’s still a constraint.
- Motion comfort: If 3D camera movements make you queasy, you’ll want to slow the navigation or keep the scene simpler. Not a deal-breaker, but worth noting.
- Data source hiccups show up fast: If the backend feed lags, the scene lags. It’s a mirror, not the chain itself, so always confirm anything critical elsewhere.
Who should probably skip it
There’s no shame in using the right tool for the job. If you live in spreadsheets and query consoles, this is a companion—not a replacement.
- Quant researchers and data engineers who need APIs, SQL, reproducibility, and bulk exports.
- Investigators who rely on labeled entities, clustering heuristics, or compliance-grade attribution.
- Auditors who need exact counts, breadcrumb trails, and change logs—precision over presence.
- Users on very low-end hardware or tight bandwidth; a lightweight 2D site will feel snappier.
Curious what your searches might reveal about you when you use any explorer—and how to keep that private without losing convenience? That’s exactly what comes next.
Privacy, safety, and trust: what you should know
Visual tools make blockchains easier to grasp, but they don’t remove the basics of online privacy. A 3D explorer is still a website, with scripts, servers, logs, and third-party requests. Treat it like you would any explorer: helpful, but not a place to overshare.
“Privacy isn’t about hiding; it’s about having control over your story.”
What data you expose
When you paste an address, txid, or block hash into any explorer, you create a data point tied to your browsing session. That’s normal—but you should know what gets broadcast:
- Your queries: the addresses/txids/blocks you search are sent to the site (and often its API provider). If you look up the same address repeatedly, it can be linked to your device via cookies and timing.
- Network and device info: IP address, user-agent, screen size, time zone, and in 3D tools, WebGL/Canvas details like GPU model can increase “fingerprint” uniqueness.
- Referrers and third parties: many sites use analytics, fonts, CDNs, or map tiles that receive request metadata. That’s another place your interest could be logged.
- Session correlation: even without an account, cookies and local storage can tie multiple lookups into one profile. Search two addresses in one session and they may be assumed related.
Real-world example: imagine you check a cold-storage address every month from the same home IP and browser. The site can correlate those checks into a pattern. That doesn’t mean they will—it means they technically can.
Want proof that fingerprinting is real? Tools like EFF’s Cover Your Tracks often show how unique a browser looks, especially with WebGL enabled for 3D graphics.
Good habits
I keep things simple and safe with a few habits that work across any explorer:
- Never paste secrets: no seed phrases, no private keys, no wallet files—ever. Explorers don’t need them.
- Lock the address bar: use HTTPS, double-check the domain, and bookmark it to avoid typosquats or lookalike phishing pages.
- Use a privacy-strong browser: Brave (with fingerprinting protections), Firefox (Enhanced Tracking Protection: Strict), or Safari with cross-site tracking blocked.
- Add shields: run a reputable blocker like uBlock Origin and consider Privacy Badger. Reduce third-party calls that don’t affect core functionality.
- Separate sessions for sensitive checks: use a private window or a separate browser profile so multiple lookups aren’t easily linked.
- Consider a VPN or Tor: a VPN breaks the IP tie to your home/office. Tor adds stronger anonymity but may be slower and can affect 3D performance.
- Mind WebGL fingerprinting: 3D visuals require WebGL, which can leak GPU details. Brave’s “Block fingerprinting” or Firefox’s resistFingerprinting can help, though visuals may degrade slightly.
- Clear site data occasionally: cookies, local storage, and cache can create long-lived identifiers.
- Be careful when screen sharing: if you’re teaching or presenting, mask addresses and txids you don’t want recorded in a meeting or saved in screenshots.
- Avoid address reuse: on-chain privacy starts in your wallet. If you reuse addresses, you leak context on-chain and in your browsing patterns.
There’s plenty of academic work showing how web trackers and browser fingerprints can correlate sessions. You don’t need to read it all. The takeaway: act like your lookups are visible to the site and any APIs it calls, and you’ll make smarter choices without losing the fun.
Reliability and accuracy
A 3D explorer is a visual layer on top of data from nodes/indexers. It’s not a consensus oracle; it’s a window. That’s why I always “trust but verify” when it matters.
- Node differences: mempools vary; a tx might show “seen” on one node and not another. That’s normal.
- RBF and reorgs: a transaction can be replaced by fee bumping (RBF), and short reorgs can change which block contains a tx. Don’t treat early states as final.
- Latency and outages: if the upstream API lags, the 3D view might look stale or skip recent tx bursts. Refresh, then cross-check.
- Confirmations beat visuals: for payments, wait for the confirmations you require, then verify on a second explorer before acting on the result.
My quick workflow when stakes are high: view it in 3D to understand context fast, then confirm the exact txid/block details in a standard explorer. Two sources, two perspectives, fewer mistakes.
So when should you lean on the visual experience, and when is a classic list or chart the smarter pick? That’s where the real edge appears—ready to see which jobs 3D nails and which 2D still owns next?
3D vs 2D: alternatives and when to use each
I switch between 3D and 2D explorers every day. They’re not rivals; they’re different lenses. The trick is knowing which lens answers your question fastest.
When 3D shines
- Teaching and onboarding: Showing someone a block “arrive” and transactions clustering visually is the instant “ohhh, I get it.” In workshops, I’ve watched non-technical folks grasp confirmations, mempool pressure, and miner selection in under five minutes because they can see it.
- Spotting bursts during busy periods: During a price spike, the 3D scene pops—sudden swarms of small transactions vs. a few whales become obvious. For example, when fees spiked around a major market move, 3D made the mempool flood feel tangible; you could watch blocks fill like containers and see which flows dominated.
- Pattern recognition at a glance: Big visual differences—size, color, motion—are “preattentive” cues our brains pick up fast. Research in information visualization (think Ware; Cleveland & McGill) suggests motion and size help you spot anomalies quickly, even if 3D adds some depth ambiguity. Translation: it’s great for scanning and storytelling.
- Live presentations and status boards: If you’re on stage or running a classroom screen, 3D keeps attention. It’s less about pixel-perfect detail and more about giving the audience a live feel for the network’s rhythm.
Rule of thumb I use: 3D for “what’s happening right now?” and “show me the shape of activity.” 2D for “prove it,” “filter it,” and “export it.”
When 2D wins
- Research and auditing: Need to verify inputs/outputs, fees, or script types with precision? Head to a classic explorer. I’ll browse blocks in 3D, then confirm the details in 2D.
- Heavy filtering and tagging: If you’re drilling into addresses, entity heuristics, or label sets, you want powerful filters and metadata. I’ll hop to:
- mempool.space for fee histograms, miner templates, RBF, and live mempool stats.
- Blockchain.com Explorer for quick lookups and historical blocks/tx.
- Blockchair for advanced queries across multiple chains and export options.
- Etherscan when I’m on Ethereum—token transfers, contract events, ABI reads, labels.
- OXT for Bitcoin address clustering and graph views oriented to analysis.
- Exports and reproducibility: CSVs, APIs, and queryable endpoints are still a 2D explorer’s home turf. If you’re writing a report or handing evidence to a colleague, 2D is the dependable base layer.
- Lower cognitive friction for exact comparisons: Studies in graphical perception consistently show 2D tables and charts are better for precise comparisons (less occlusion, fewer depth illusions). If you’re measuring, not just watching, keep it flat.
Other visual experiences
Not all visual explorers aim for the same vibe. Some are built for fun and fast intuition—perfect for classrooms, status walls, or just enjoying the network “breathing.” A few favorites:
- TXStreet turns transactions into little people boarding buses (blocks). It’s playful, but it’s also a sneaky-good way to show mempool congestion and fee competition to beginners.
- BitBonkers drops coins as discs in a physics world. Mesmerizing—and surprisingly useful for feeling transaction size distribution without reading a single number.
Each of these gives you a mental model that text can’t. I keep them handy for live events and teaching. For a broader list of explorers and visual tools I rely on, check my running resources here: Blockchain Explorers.
So, which should you open first the next time fees spike or a big block hits? And what about cost, chains supported, and whether your laptop will handle it smoothly? I’ll answer those in the next part—plus a few tricky questions people always ask before they trust a new explorer.
FAQ and final take: is Blockchain 3D Explorer worth it?
Is Blockchain 3D Explorer free?
Yes. Visiting blockchain3d.info and using the visualization is typically free in the browser—no account, no wallet connect. I haven’t seen paywalls for the core 3D view. If paid tiers ever appear, expect them to be about higher data retention, custom scenes, or presentation features. For casual use and classroom demos, the free version is more than enough.
Does it support multiple blockchains?
In practice, the focus is usually Bitcoin. If other chains are supported, you’ll see a selector or toggle in the interface. Features can differ per chain (for example, mempool depth or historical playback length), so if you switch networks, scan the legend and controls again to make sure you’re reading the scene correctly.
Is it safe to use?
It’s safe for viewing public data. You never need to share private keys, seed phrases, or sign anything. Your searches (addresses, txids, blocks) may be logged by the site or its API providers, so treat it like any other explorer.
- Use a privacy-friendly browser and consider a VPN if you care about linking queries to your IP.
- For anything sensitive, confirm on a second explorer such as mempool.space, Blockchair, or Blockchain.com Explorer.
Do I need a powerful PC or GPU?
You’ll have a better time with a modern browser (WebGL/WebGPU enabled) and a decent GPU. If it stutters or gets choppy, try this:
- Lower quality settings and disable shadows/reflections if available.
- Reduce the number of visible objects (for example, hide older blocks or limit mempool objects).
- Pause live mode when you’re focusing on a single block or transaction.
- Close other heavy tabs—3D in the browser loves RAM.
Quick tip: If you feel motion-sensitive, slow the camera speed and use step-by-step zoom instead of long, fast pans.
Can I search by address, txid, or block?
Yes—paste an address, txid, or block identifier into the search. When it resolves, the camera usually centers and highlights the object. A few quirks to keep in mind:
- Use full identifiers. Partial txids are often not supported.
- Bech32 addresses are case-insensitive; copy/paste exactly as shown and avoid trailing spaces.
- Some tools distinguish between block hash and block height. If a height doesn’t work, try the hash instead.
- Very old or very new (mempool) data may render differently; give it a second to fetch.
How accurate is the visualization?
The 3D view mirrors the data source feeding it. When precision matters (fees, exact inputs/outputs, confirmations), I always cross-check on a 2D explorer. This isn’t a knock on the tool—3D is fantastic for context and pattern spotting, but exact numeric reading is historically stronger in 2D layouts.
If you’re curious why, UX research has noted that 3D visuals can reduce exact reading accuracy compared to 2D charts, even as they boost engagement and recall. See Nielsen Norman Group on 3D visualizations and classic work on graphical perception by Cleveland & McGill. On the flip side, educational studies show that visuals and animation can help build mental models for dynamic systems—useful when teaching blocks, mempools, and confirmations (e.g., Tversky et al., 2002; Dual-coding theory).
Will it help me spot real patterns or is it just eye candy?
It’s more than eye candy. I’ve used it to notice:
- Fee pressure spikes when the mempool gets crowded—blocks visually pack tighter, and large transactions stand out.
- Timing clusters around market news—the scene shows bursts of activity in a way text lists don’t.
- Teaching moments—students grasp confirmations faster when they watch incoming blocks “lock in” prior transactions.
After I spot something, I jump to a 2D explorer to quantify it. That one-two punch is where it shines.
Can I use it for professional analysis?
As a first look, absolutely. For deep work—entity tagging, exportable lists, chain heuristics—switch to heavy hitters like OXT, mempool.space, or Blockchair. Think of the 3D tool as your radar screen, not the flight recorder.
Final verdict
I’m keeping blockchain3d.info bookmarked. It won’t replace a 2D explorer for audits or research, but it’s fantastic for learning, teaching, presenting, and getting fast intuition when the network heats up. If you value clarity and engagement, it earns a spot next to your go-to explorer. If you live in spreadsheets and CSVs, use it as your visual sidekick for those “what’s happening right now?” moments—and then confirm the details where they belong.