Bitcoin Node Map & Blockchain Visualization Tools (2026)
Bitcoin Nodes, Blockchain Visualization Sites, and the Cryptocurrency Market: The Ultimate Review
Ever feel like the world of crypto is just a massive web of confusing data? What if I told you there’s a way to actually see what’s going on in real time? And what about those mysterious “Bitcoin nodes” people keep talking about—are they as important as they sound? Let’s break it down.
The Challenges of Understanding Blockchain and Crypto Activity
Let’s be real: the crypto universe isn’t exactly straightforward. From the complicated jargon to numbers flying across volatile screens, it’s easy to feel lost. Here are some of the key questions that often leave people scratching their heads:
- What exactly is a “Bitcoin node,” and why is it important?
- How can you watch blockchain activity as it happens?
- Is there a simple way to track market trends without using dozens of tools?
If this has ever crossed your mind, you’re not alone. Crypto can feel technical, intimidating, and just plain confusing when you’re trying to make sense of endless transactions and trends.
The Solution: Tools That Make It Visual and Understandable
Here’s where things start to get exciting. There are tools out there that can help you see the blockchain in action, track transactions in real time, and get a visual grasp of this ever-moving ecosystem. Imagine interactive maps bursting with transactions or dashboards highlighting market trends in colorful, engaging ways. Cool, right?
Websites like these don’t just make crypto data easier to interpret—they make it fun. They’re like a bridge, connecting the technical complexity of crypto with something you can understand and actually enjoy exploring.
Why Visualization Matters
Think of it this way: the crypto world isn’t just a bunch of numbers hovering on a screen—it’s alive. It’s a network of transactions happening all around the globe, a dynamic system constantly evolving. Visualization tools help you connect the dots in this intricate web, showing you the “big picture” in a way that’s both fascinating and practical.
Whether you’re an investor looking to identify trends, a researcher monitoring the market, or just someone curious about what makes Bitcoin tick, using these tools can be a total game-changer.
But wait—before we jump into examples or tools that make all of this easy, let’s rewind for a second. What's really holding the entire Bitcoin ecosystem together? You’ve probably heard the term Bitcoin node thrown around, but why is it so critical? Stick around, because we’re about to uncover the secret to why nodes are the real backbone of this decentralized revolution.
What Are Bitcoin Nodes and Why Should You Care?
The foundation of Bitcoin lies in its nodes. They’re not just another buzzword in the crypto world. They’re the unsung heroes working tirelessly behind the scenes to keep the Bitcoin network secure and decentralized. And here’s the thing: understanding them can truly open your eyes to how Bitcoin actually works.
Understanding Bitcoin Nodes
Imagine this: a Bitcoin node is like the backbone of the network. It does three incredibly important things:
- Validates transactions to make sure nobody is trying to cheat the system.
- Enforces the rules that ensure Bitcoin stays fair and decentralized.
- Stores a full copy of the blockchain, which is essentially the entire transaction history of Bitcoin.
To put it simply, without nodes, the Bitcoin network wouldn’t even exist. They’re the reason Bitcoin is trustless—you don’t need to rely on a bank or any third parties. It’s just the network, and the nodes are its true watchdogs.
Why Nodes Are Critical for Security
Let’s talk about security. In the Bitcoin network, nodes play the role of the ultimate guardians. They verify every transaction, ensuring that no one can spend the same Bitcoin twice. Without them, the concept of decentralization would collapse. A centralized system could fudge numbers, but Bitcoin nodes? They have one job: to stick to the rules, no exceptions.
“When you lose control over your money, you lose control over your freedom.”
That quote isn’t just poetic—it’s the reality Bitcoin nodes fight to protect. They make Bitcoin resistant to censorship and fraud. If just one node notices something off, it rejects the invalid transaction, keeping the network honest.
Should You Run Your Own Node?
This is where things get interesting. Should you become part of the magic by running your own Bitcoin node? Here’s what you get out of it:
- Full Control: You validate your own transactions instead of relying on someone else’s node. This means you don’t need to trust anyone to do it right.
- Better Privacy: Running your own node keeps your activity more private. Otherwise, whoever runs the node you use will see what you’re up to.
- Supporting the Network: Being a node operator means you’re contributing to Bitcoin’s decentralization and strength—a huge win for the whole ecosystem.
Now, let’s keep it real. Running a node isn’t for everyone. It requires some technical skills, a bit of time, and your computer needs to store the entire blockchain (which is currently over 500 GB and growing). But if you’re into crypto for the long haul, running a node is like stepping up your game—you’re not just a user; you’re part of the infrastructure.
So, here’s the big question: are nodes the unseen heartbeat of the blockchain, or can you really experience Bitcoin without them? Hold that thought, because next, we’re talking about something visually stunning that brings the blockchain to life in ways you’ve never imagined.
How Blockchain Visualization Sites Simplify Crypto
Tired of staring at boring charts and endless rows of numbers? Let’s be honest, raw data can feel like ancient hieroglyphics sometimes. The good news is, blockchain visualization sites exist to bring that data to life. Imagine watching a live orchestra of transactions, market movements, and blockchain activity playing out on your screen—it’s mesmerizing and uniquely educational.
The Power of Seeing the Blockchain
Here’s the thing: numbers alone don’t always tell the full story. Visualization sites dig into the behind-the-scenes action and present it in a way that’s not only easier to understand but also incredibly engaging. Whether it’s a blockchain explorer lighting up with real-time Bitcoin transactions or a heatmap painting the market trends, these visuals add a whole new perspective.
A perfect example? Picture this: you’re watching a world map light up, showing Bitcoin being traded from one corner of the earth to another. Talk about connecting a global ecosystem in real-time! This kind of visualization transforms blockchain data into something you can actually see and make sense of.
Key Benefits of Using Visualization Sites
Why bother with visuals? Because they make everything so much easier to grasp. Think about these benefits:
- Spot big moves: Want to see when a whale transfers Bitcoin or when huge trades happen? These tools let you track everything clearly.
- Track emotions in the market: Heatmaps and transaction flows give clues about buying or selling momentum.
- Network health: Keep tabs on blockchain activity to see how busy, secure, or active the network is.
- Simplify it for newbies: If you’re newer to crypto, seeing the blockchain visually can strip away a lot of the confusion.
It’s kind of like watching the stock market floor but with way cooler visuals. And it’s not just for beginners—veterans use these tools to spot trends and avoid missing out on key insights.
Who Should Use These Tools?
Honestly? Everyone. Blockchain visualization tools cater to every kind of crypto enthusiast, from the curious beginner to the hardcore market analyst. Here’s who can benefit the most:
- Investors: Keep an eye on market trends and pick smarter entry or exit points.
- Students & Researchers: Use these tools to learn how blockchain tech works or track cases for analysis.
- Day Traders: Quick insights can help you understand price swings or market sentiment in the blink of an eye.
- Crypto Enthusiasts: Ever wanted to just geek out on how blockchain ‘looks’ in action? This is for you.
Honestly, it’s one thing to look at a report saying Bitcoin’s on fire, but it’s a whole other feeling to literally watch it happening in real time. And hey, it’s okay if you’re just curious or exploring this to wow your friends—it’s oddly fun no matter why you're here.
“Data is just numbers until you add meaning—visualization makes blockchain data human.”
The next question you’re probably asking is this: What are some of the best tools out there to actually see this magic unfold before your eyes? Hang tight because you’re about to find out, and I promise some of them will blow your mind.
Example Sites: The Best Blockchain Visualization Tools
The blockchain world is fascinating, but let’s be honest—it can also feel like staring at a wall of endless, incomprehensible numbers. Thankfully, some creators out there have made it their mission to turn blockchain activity into something vivid, interactive, and even fun. Let me share with you a few outstanding blockchain visualization tools that I think you’re going to find absolutely worth checking out.
Coin360
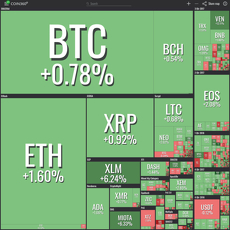
Quick, colorful, and incredibly insightful, Coin360 has managed to become a favorite in the crypto community. Why? Because it transforms dry market data into a dynamic heatmap that's visually stunning and easy to read. Imagine this: a single screen showing you the real-time status of the crypto market, complete with live prices, market caps, percentage changes, and trading volumes for every coin.
If you’re a visual thinker, Coin360 is your holy grail. The heatmaps color-code cryptocurrencies to reflect their performance—green for gains, red for losses. This not only gives an overview of the market's health but also allows you to spot trends instantly. Whether you're tracking Bitcoin dominance or looking for unexpected altcoin movers, this tool makes the process seamless and enjoyable.
“Data is dull until you can see it move. Coin360 makes the market come alive.”
Check it out yourself at Coin360—you won't regret it.
FiatLeak.com
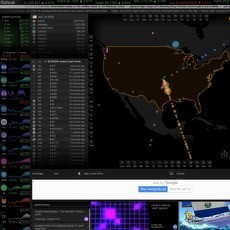
If you’ve ever asked yourself, "Where are people buying Bitcoin right now?", FiatLeak has the answer in the most captivating way possible. This tool turns global Bitcoin transactions into live data flowing across a world map. A transaction in Japan? You’ll see it pop up. A surge in Europe? Watch the action unfold live as BTC streams like fireworks from country to country. It's truly mesmerizing.
FiatLeak feels less like a tracker and more like watching a global Bitcoin story unfold in real-time. For those interested in understanding how geography plays into cryptocurrency adoption, this tool adds a whole new layer of context. Plus, it’s totally free to use!
Blockchain 3D Explorer
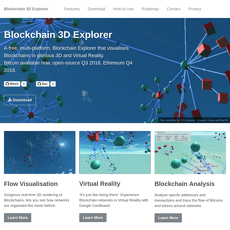
Have you ever wanted to experience the blockchain as if you were walking through it? Prepare to be amazed because Blockchain 3D Explorer does exactly that. This tool lets you literally “step inside” the blockchain using a captivating three-dimensional perspective.
You can browse transactions as if you were looking at a cityscape. Huge transactions? They’re represented like skyscrapers, towering over smaller ones. It’s the perfect tool for anyone who wants to understand transaction flows without staring at dull tables. Plus, showing this off to friends is guaranteed to leave them speechless.
The 3D interface is more than just eye candy—it’s functional. You can track Bitcoin transactions, wallets, and even better understand how blocks are connected. A truly next-level experience.
BitListen
Okay, this one is just plain cool. BitListen takes Bitcoin transactions and transforms them into a live, musical symphony. Yes, you read that right! Each Bitcoin transaction is translated into a sound, and depending on the transaction size, the sound will differ in pitch and tone, creating a relaxing—and surprisingly addictive—experience.
It’s not only a creative way to “listen” to the blockchain, but it’s also a great reminder of how busy and alive the network is. Large transactions create deeper tones, while smaller ones sound lighter. Who knew blockchain could be this artistic?
If you want a break from crunching numbers and just want to enjoy the soothing side of crypto, fire up BitListen and let the network play its music.
What Else Is Out There?
Exciting, right? But these tools are just scratching the surface. You might be wondering—what other unique visualization tools can take your crypto curiosity to the next level? Let me introduce you to more innovative ways to experience this mind-blowing ecosystem. From virtual reality platforms to gamified experiences, there’s something fresh waiting around the corner.
Other Nifty Tools You’ll Want to Bookmark
Let’s be honest, the crypto world is full of surprises and creative ways to make things more exciting. Sometimes, it’s not just about seeing the data—it’s about experiencing it. That’s where these other brilliant tools step in. If you’re ready to add a few gems to your crypto dashboard, keep reading because these are definitely worth checking out.
BitcoinCity
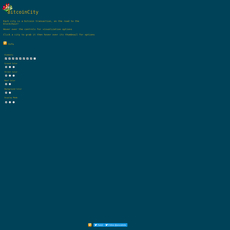
Imagine a bustling virtual city, but instead of traffic jams and skyscrapers, it’s all about Bitcoin blocks, transactions, and network health. BitcoinCity transforms the blockchain into a visual masterpiece. Each “building” represents blocks as they’re created in real time, complete with details about block size, fees, and more.
It’s not just a pretty landscape; it’s packed with insights. You can monitor network activity at a glance while feeling like you’re part of a digital metropolis. It’s an awesome tool for educators trying to explain block creation or just anyone who prefers visuals over spreadsheets.
"The blockchain is not just data; it's a living, breathing structure. BitcoinCity turns it into something you can almost touch."
If you’re curious about the city-wide view of Bitcoin’s health, this tool belongs on your list.
Bitcoin VR
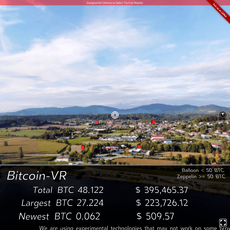
Think crypto is groundbreaking? Wait until you experience it in virtual reality. With Bitcoin VR, you can wear a VR headset and transport yourself into the blockchain. It allows you to watch transactions and blocks as they happen, literally surrounding you with 3D streams of data.
Why stick to charts on your monitor when you can immerse yourself? This might sound futuristic, but it’s happening now, and it’s ridiculous how cool it is. If you’ve got a VR setup, this is a must-try. You'll never look at Bitcoin the same way again.
Bit Force
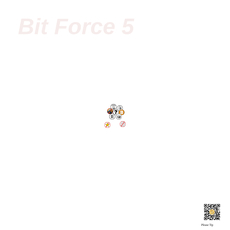
Do you ever wonder how Bitcoin miners are keeping the network alive or how smooth transaction flows are at any moment? Bit Force is a stellar tool that displays real-time Bitcoin mining activity and transaction speeds. It’s like watching the heartbeat of Bitcoin itself.
This tool even tracks hash rates and shows you how powerful the network is at resisting attacks or handling the never-ending flow of transactions. For those who geek out over mining stats or want to see how robust Bitcoin is under the hood, this one is your new favorite.
One cool takeaway? You can use it to spot moments when the network is especially busy, giving you insights for timing transactions or simply understanding the network’s dynamic nature.
So What’s Next?
Feeling inspired yet? Trust me, the crypto community didn’t stop at visuals and VR. There’s another layer to peel back—one that might just reveal the ultimate reason why these tools are becoming so wildly popular. Ready to see what’s making everyone talk?
Why Are Visualization Sites Hot in the Crypto Community?
Let’s be real—there’s a reason why visualization tools are blowing up in the crypto world. They’re not just “nice to have”; they’re becoming essential. Why? Because these platforms turn what used to be mountains of dry data into something exciting, interactive, and, most importantly, understandable.
Use Cases for Blockchain Visualization
Imagine this: you’re scrolling through a blockchain visualization site, and suddenly you spot a massive transaction worth millions of dollars moving across the network. That’s a whale in action—a term for those gigantic transactions that can shift the market. With a tool like this, you’re not just hearing about crypto activity; you’re seeing it. These tools are perfect for:
- Spotting market trends. Watch how funds travel and identify patterns that could indicate where the market is headed.
- Teaching crypto to your friends or team. Instead of explaining the concept of blockchain with words, show them an interactive map. It clicks so much faster!
- Discovering anomalies. If there’s something unusual happening, like an abnormal number of transactions, you’ll catch it visually in seconds.
Trendy Features Everyone Loves
These visualization sites are addictive for a reason—they offer incredible features that keep people coming back for more. Here’s what’s making waves right now:
- Real-time transaction feeds. Tools like FiatLeak showcase Bitcoin movement across countries in actual time. It’s like watching global crypto energy flow through the internet.
- Interactive dashboards. Platforms like Coin360 use heatmaps to show how individual coins are performing and shifting in the market. It’s colorful, dynamic, and highly informative.
- Virtual reality experiences. Yes, VR is a thing in this space! Tools like Bitcoin VR let you experience the blockchain in a 3D world as if you were cruising through a matrix of transactions. It’s mind-blowing.
“The simple act of visualization can turn confusion into insight. Data tells stories; visuals make you listen.” – Unknown
How This Impacts the Average Investor
So, where do you fit into all this? Here’s the thing—if you’re holding crypto or thinking about investing, these tools go beyond entertainment. They offer insights that can shape your strategy. Let’s say you notice a whale moving funds to an exchange. That could be a heads-up: Are they about to sell? Could the market dip? Understanding these dynamics gives you a leg up.
And it’s not just about whales. If you’re tracking your favorite altcoin, tools like real-time heatmaps can help you catch its momentum as it builds. It’s perfect for riding waves before others even notice them.
Ever felt stuck picking a tool that fits your goals perfectly? Coming up next, I’ll share how to figure out which platform is tailored to what you actually need. Stay with me—it’s going to be worth it.
How to Choose the Right Tool for You
Let’s be honest: the crypto world is packed with exciting tools, but finding the perfect one? That can feel like searching for the proverbial needle in a haystack. Don’t worry—I’ve got you covered. Choosing the right blockchain visualization or market tracking tool boils down to understanding what you need and what fits your style. Let me walk you through how to nail it.
Identify Your Goal
Why are you here? This might sound like a philosophical question, but trust me, it’s at the heart of finding the right crypto tool:
- Are you all about Bitcoin? Tools like FiatLeak focus solely on Bitcoin movements, while others like Coin360 give you a complete market picture.
- Investing in the crypto market? Heatmap-style tools (like Coin360) simplify tracking winners and losers in real time.
- Just exploring for fun? Try quirky tools like BitListen—Bitcoin transactions transformed into musical notes. It’s quirky, soothing, and unlike anything else out there.
Once you’re clear on what you want to achieve, narrowing down tools becomes a heck of a lot easier.
Free vs. Paid Tools
Ah, the age-old question: should you stick to free versions or pay for premium features? The answer depends on how deeply you want to go:
- Free tools: Most of the tools I’ve explored offer incredibly valuable features for free. For example, Coin360’s heatmaps and FiatLeak’s live world transaction map are free and packed with insights.
- Paid options: Some platforms, like analytics-heavy charting tools or premium visualization dashboards, bundle advanced insights behind a paywall. Consider going premium if you’re a serious investor or researcher who needs detailed forecasting and historical data.
Here’s a tip: Start with free tools. Play around, get comfortable, and explore all the features. If it feels limiting and you find yourself itching for deeper insights, then investing in a paid option might be worth it.
User Experience and Features
Think of these tools as a pair of shoes. They might all “work,” but if they don’t fit, you’re going to be uncomfortable. What should you look for?
- Ease of use: Choose tools with clean interfaces where data is easy to find and interpret. No one has time for a ten-step process just to get a simple answer.
- Features that align with your needs: Like 3D visualization? Blockchain 3D Explorer offers an immersive experience. After live market data? Tools like Coin360 or FiatLeak should top your list.
- Reliability: Stick with platforms that update data in real-time and have a track record in the crypto community. A visualization tool is only as good as the accuracy of its information.
Which Tool Feels Right?
There’s no ‘one size fits all’ here. The best advice? Test a few. See what sparks your interest or solves your problem the quickest. You’ll know it when you find it because it feels effortless, exciting, and, most importantly, useful.
"The right tools don’t just give you answers; they make the entire process enjoyable." – Anonymous Crypto Enthusiast
So, where should you go from here? Well, are tools enough, or are you curious what else is out there to take your crypto learning further?
Bonus: Other Resources Worth Exploring
If you’ve been following along and geeking out over blockchain visualization tools, guess what? There’s so much more in the crypto world to keep that curiosity alive. Whether you're just getting started or you’ve been around the block (pun intended), these extra resources are pure gold for diving deeper into Bitcoin and cryptocurrency knowledge.
Get Into the Details with Block Explorers
Sometimes, you just want to know the specifics—like, what’s happening with that Bitcoin address or where a transaction is heading. That’s where block explorers come in. A block explorer is a tool that lets you look into the blockchain and track transactions, wallet balances, and more. I recommend checking out trusted explorers like Blockchain.com.
It’s like having a magnifying glass for every detail in the blockchain network. Want confirmation that a payment went through? Curious about mining rewards? This is the kind of tool you’ll always come back to for quick answers.
Communities and News Sources That Keep You in the Loop
Let’s be honest, the crypto world moves fast—like blink-and-you-miss-it kind of fast. That’s why staying connected is key. Some of the best ways to keep your finger on the pulse are through top-notch news platforms and active communities. A few I trust and recommend include:
- CoinDesk: Up-to-the-minute news, in-depth analysis, and trends shaping the crypto space.
- Reddit: Check out r/cryptocurrency for community discussions and insights from crypto enthusiasts all over the globe.
- Twitter: Don’t sleep on Twitter—follow major crypto influencers and company accounts to stay ahead of the curve.
Whether you’re hunting for breaking news or just looking to join the conversation, these platforms are where the lifeblood of the crypto community resides. Remember, being informed is as important as the tools you use.
Tip: Bookmark these websites and check them regularly. Crypto is dynamic—don't let FOMO (fear of missing out) catch you off guard!
Here’s the thing: whether you’re learning about Bitcoin through easy-to-follow guides or tracking down a single transaction with a block explorer, these resources make the crypto universe fascinating and accessible. But want to know how all of this actually fits together and why visualization sites and resources like these matter so much? You’re going to want to stick around for the final section, because there’s one last piece of the puzzle you need to see.
Wrapping it All Up: Making Crypto Visual and Easy
The world of cryptocurrency can feel like a massive puzzle sometimes, right? But here’s the cool part—there are tools out there that make everything feel so much simpler. Whether you’re someone who's casually curious or aiming to be the next crypto expert, visualization tools are absolute game-changers.
Why These Sites Matter
Let’s be real—crypto isn’t just about staring at data. Numbers don’t do the whole story justice. Seeing the blockchain in action, watching massive Bitcoin transactions cross the globe, or exploring networks in 3D just hits differently. These tools add a visual perspective that brings a deeper understanding and excitement about what’s really going on.
For example, platforms like FiatLeak show live Bitcoin purchase flows from one country to another in real-time. It’s not just fascinating—it’s eye-opening. You’ll start noticing patterns, like how specific countries spike in activity depending on the time of day. That’s the kind of insight you can’t get from a regular price chart.
Start Exploring Today
You don't need to be a tech whiz to try these tools. Each one has its unique charm, and exploring them is half the fun. Not sure where to start? Pick something simple like Coin360, where you can see live heatmaps of market activity. Or, if you’re in the mood for something quirky, BitListen turns Bitcoin transactions into music—watching the blockchain has never been so relaxing.
There’s also the 3D visualization fan-favorite, Blockchain 3D Explorer, where you can walk through Bitcoin blocks as if they were physical structures. It’s a surreal experience seeing a digital network transformed into something you can navigate like a video game.
Conclusion: Find Your Favorite
The best part? There’s no one-size-fits-all approach. You might start with a heatmap and end up diving into VR-based blockchain explorers. Or maybe you’ll fall in love with sound-driven tools that turn dry transaction data into something lively. Whatever your preference, keep experimenting until you find the ones you connect with.
Start today. Pick a tool. Get curious. Before you know it, you’ll be exploring the crypto space like never before. Bookmark your favorites, and let them guide you through this dynamic and ever-changing world of blockchain and cryptocurrencies.
Trust me—crypto doesn’t have to stay mysterious. When you have the right resources, it becomes clear. Fun, even.

