History of Bitcoin Review

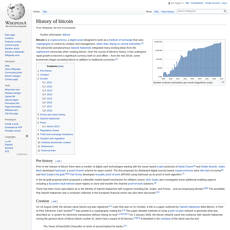
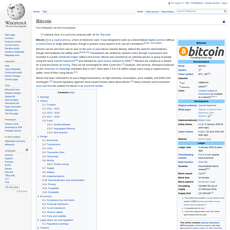
History of Bitcoin
historyofbitcoin.org
HistoryOfBitcoin.org Review Guide: Everything You Need to Know + FAQ
Ever wished you could pull up a clean, no-noise timeline that shows Bitcoin’s story from day one to today—without chasing conflicting dates across five tabs? If that sounds like you, keep reading.
The problem with most Bitcoin timelines
Here’s the honest truth: most “Bitcoin history” pages are either biased, outdated, or so stuffed with fluff and pop-ups that you forget why you clicked. When you’re researching, you want clean dates, crisp milestones, and links that actually help you confirm what happened.
Real-world examples of the chaos:
- Conflicting dates: I still see blog posts misplacing the first halving (it was November 28, 2012) or mixing up SegWit’s activation (August 24, 2017) with the UASF date (August 1, 2017).
- Missing context: Mt. Gox is often shown as a single “2014 collapse” line, but the timeline of withdrawals, suspension, and bankruptcy filings matters if you’re explaining why custodial risk is a big deal.
- Inflated noise: Too many timelines cram in every minor headline, so you can’t see the big arcs: innovation → adoption → setbacks → resilience.
- Ad fatigue: Pop-ups, autoplay, and interstitials make it hard to track events in sequence, especially on mobile.
Good timelines don’t just list events—they help you see cause, effect, and momentum.
There’s also a cognitive angle here. Research on memory (think Ebbinghaus’ forgetting curve and the power of chunking) shows that structured, chronological views make complex topics easier to recall. With Bitcoin’s 15+ years of milestones, a clear, verifiable timeline isn’t a luxury—it’s a tool.
What I’m offering you here
I went looking for a timeline that stays out of the way and helps me check facts fast. In this guide, I’ll break down how to use HistoryOfBitcoin.org like a power user—what it gets right, what to watch for, and how to double-check anything you plan to cite.
Who this is for
- Beginners: You want the story without falling into rabbit holes or hype.
- Students: You need clean anchors for papers and presentations.
- Journalists and analysts: You want to confirm dates, grab primary sources, and move on.
- Crypto folks: You want a fast refresher on halvings, forks, and headline events.
What you’ll get from this guide
- How Bitcoin’s history is organized into eras you can scan quickly: genesis, halvings, forks, crashes, upgrades.
- Must-see milestones and why they matter beyond the headline (e.g., why SegWit unlocked Lightning’s growth).
- How to pair the timeline with primary sources for bulletproof citations.
- Shortcuts to spot bias, gaps, or outdated entries without wasting time.
How I approached the review
I checked the early years (2008–2012), the bubble cycles (2013, 2017, 2021), major security incidents (e.g., Mt. Gox 2014, Bitstamp 2015), and key protocol upgrades (SegWit 2017, Taproot 2021). I looked for:
- Coverage: Are the landmark events accounted for?
- Consistency: Are dates and descriptions aligned with primary sources?
- Update cadence: Does it keep up with major milestones without getting bloated?
- Usability: Can I fact-check on desktop and mobile in under a minute?
If you’re tired of opening a dozen tabs to resolve one date or quote, you’ll like where this is going. So what exactly is HistoryOfBitcoin.org and how does it work in practice? Let’s open it up and walk through it next.
What is HistoryOfBitcoin.org and how it works
When I need the clean, no-noise version of Bitcoin’s story, I open HistoryOfBitcoin.org. It’s exactly what it sounds like: a minimalist timeline that surfaces the moments that actually matter—no autoplay videos, no distracting sidebars, just Bitcoin’s key events in order, from 2008 to today.
“Chancellor on brink of second bailout for banks” — embedded in Bitcoin’s Genesis Block, 3 Jan 2009
That line hits every time. This site lets you jump straight to that entry, then move up and down the years to see how the network, markets, and community evolved around it. Think of it as a curated index to the primary sources and definitive reports behind Bitcoin’s milestones.
What the site shows at a glance
Each entry is short, scannable, and linked to something useful. Typical event cards include:
- Date stamp: e.g., 2008-10-31 for the whitepaper publication.
- One-line description: what happened and why it’s notable.
- Outbound links: to original documents, code proposals, forum posts, or reputable coverage.
Real examples you’ll recognize:
- 2008-10-31: Satoshi posts the whitepaper to the Cryptography Mailing List — linked to the original email and the PDF on Bitcoin.org.
- 2009-01-03: Genesis Block — with the UK Times headline providing context for Bitcoin’s DNA.
- 2010-05-22: Pizza Day — points to the famous Bitcointalk thread.
- 2017-08: SegWit activation and the Bitcoin Cash fork — links to BIP-141 and coverage that explains the split.
- 2021-11: Taproot — references BIP-340, BIP-341, and BIP-342.
- 2024-01: U.S. spot Bitcoin ETF approvals — often linked to regulator documents and mainstream financial press.
Everything is purpose-built for quick learning and fast fact-checking. You can scroll, spot what you need, and jump out to original sources in seconds.
How content is organized
It’s chronological, year by year. That sounds basic, but that’s the strength. You can:
- Scan early years to understand the culture and bootstrap phase (mailing lists, forum posts, first clients).
- Watch exchanges and infrastructure appear, scale, and sometimes fail.
- Track protocol changes right alongside market and regulatory events to see cause-and-effect.
Pro tip: use your browser’s Find (Ctrl/Cmd + F) for keywords like “SegWit,” “Taproot,” “Mt. Gox,” or “halving.” It’s a ridiculously fast way to anchor yourself in the right year.
Sources and reliability
The site works best as a hub that points you to the right source. When I’m judging the reliability of an entry, I look for:
- Primary docs: Satoshi’s emails (metzdowd), Bitcointalk posts, and the whitepaper.
- Technical references: BIPs on the official Bitcoin BIPs repo and Bitcoin Core release notes.
- Regulatory records: SEC/ECB/FCA publications and official announcements.
- Reputable reporting: long-running outlets with editorial standards (e.g., CoinDesk, WSJ, FT) for context around market shocks.
When you need absolute certainty, follow the entry’s link to the original artifact, then confirm with a second independent source. That’s standard research hygiene, and this site makes it painless.
Update cadence
It prioritizes marquee events: protocol upgrades, security incidents with ecosystem impact, macro/regulatory milestones, and historic price moments. Smaller developer chatter or niche proposals won’t always show up right away. If you’re checking something that happened last week, scroll to the current year and then cross-check with the linked sources or a trusted outlet.
I’ve noticed big milestones tend to appear quickly, while nuanced items (say, a soft consensus moment on a mailing list) can take longer—fair trade-off for a timeline designed to stay readable.
Navigation and usability
This is where it shines. Minimal design reduces cognitive load and makes scanning almost effortless. There’s a reason usability research keeps saying “less is more” on the web—scannable layouts are easier to understand and remember. Nielsen Norman Group has shown for years that people read in an F-shaped pattern and perform better with concise, well-structured content (NN/g study).
In practice, that means:
- Fast page load and instant scrolling.
- Clear dates and short explanations instead of bloated paragraphs.
- No intrusive pop-ups or auto-refresh distractions.
Mobile experience
It’s lightweight, which matters on the go. Google’s research famously found that a big share of users abandon mobile sites that take over 3 seconds to load (Google Mobile Speed). This timeline keeps things lean, so you can check a date during an interview, in a classroom, or while tweeting a correction—without waiting.
Text is readable, links are easy to tap, and you can move through years with your thumb. It’s the kind of mobile experience that makes you keep using a reference site because it respects your time.
I’ll show you how to read Bitcoin’s story through the most important chapters next—want to see where the whitepaper, Pizza Day, the exchange booms, the forks, and the halving cycles all connect into one clear narrative?
The key chapters of Bitcoin’s history (and how to read them on the site)
Good timelines don’t just list dates—they help you feel the arc: invention, discovery, growing pains, and steady hardening. Here’s exactly how I read the timeline to get that story without getting lost.
Origins: Whitepaper, Genesis Block, early mailing lists
Start at 2008–2009. That’s where the blueprint and the spark live. You’ll see the whitepaper (Oct 31, 2008), the Genesis Block (Jan 3, 2009), and the early mailing list chatter that shaped the rules of the game. Don’t skip the Genesis coinbase message—“The Times 03/Jan/2009 Chancellor on brink of second bailout for banks.” It sets the tone for everything after.
“Running bitcoin.” —Hal Finney, Jan 10, 2009
- Open the whitepaper link to understand the threat model and goals in Satoshi’s own words: bitcoin.org/bitcoin.pdf
- Scan early 2009 entries for the cryptography mailing list posts that debated timestamps, incentives, and nodes.
- Click into the Genesis Block reference to see the embedded headline for historical context.
First real-world uses: Pizza Day and early markets
Jump to 2010. That’s where “magic internet money” touched real life. The 10,000 BTC pizza purchase (May 22, 2010) is the emotional milestone—you feel the shift from theory to value. Right around it, early pricing experiments appear: NewLibertyStandard’s rough valuation (2009) and the launch of BitcoinMarket.com (March 2010) show how price discovery started before order books matured.
- Find Pizza Day and follow the linked forum post to see the original ask and fulfillment—great for teaching value formation.
- Check the earliest exchange entries to see how liquidity began and why spread/volatility were wild.
Exchange era and volatility
2011–2013 is the roller coaster era. Mt. Gox’s rise, liquidity spikes, $1 to $32 and back, then $266, then $1,000+, then winter. This is where you understand that Bitcoin’s price history is a story of tiny float, narrative shocks, and infrastructure catching up. Fast forward to 2017 ($20k), 2021 ($69k), and then the deleveraging of 2022. When you stack these cycles, you learn to respect volatility as a feature of monetization, not a bug.
- Skim 2011, 2013, 2017, 2021, and 2022. Note how exchange launches, outages, and new instruments (like futures) map to sharp moves.
- Open entries around peaks and troughs to see what headlines set the tone (tech upgrades, forks, regulation, macro shocks).
Security incidents and lessons
Two tracks matter here: protocol and platforms. On the protocol side, the 2010 value overflow bug (Aug 15, 2010) is crucial—184 billion BTC accidentally created and quickly fixed by a coordinated upgrade. It shows the network’s early social layer and its capacity to respond. On the platform side, the big exchange breaches (Mt. Gox 2014, Bitfinex 2016) and later custodial issues taught the internet a phrase that still matters: not your keys, not your coins.
- Read the overflow bug entry to see how fast fixes propagate when incentives are aligned.
- Open exchange hack entries and follow restitution timelines; use them to explain self-custody and multisig.
Protocol upgrades and forks
This is the “why Bitcoin keeps hardening” chapter. Look for P2SH (2012), BIP66 (2015), SegWit (activated Aug 24, 2017), and Taproot (Nov 14, 2021). Each upgrade tightened rules or expanded capability without breaking the core guarantee. Right alongside, you’ll see social coordination flashpoints like the 2017 block size debate and the Bitcoin Cash hard fork (Aug 1, 2017). That split is a case study in how governance by rough consensus and running code actually works in practice.
- Open SegWit and Taproot entries for links to BIPs and activation details; they’re perfect for explaining soft forks vs. hard forks.
- Follow the 2017 timeline sequentially to watch UASF, miner signaling, and the fork play out day by day.
- Check Lightning Network milestones nearby to connect upgrades to real-world scaling.
Halving cycles and macro context
The halving cadence is the tempo of the timeline: 2012-11-28, 2016-07-09, 2020-05-11, 2024-04-20. Issuance drops by 50%, miner economics shift, and attention returns. Historically, major narratives tend to build in the 12–18 months after (with plenty of noise along the way). Layer in macro: Cyprus (2013), the COVID-19 shock and liquidity crunch (March 2020), global inflation and rate hikes (2021–2022). You’ll see why the same asset can feel different under different monetary regimes.
- Use each halving as an anchor point, then scan forward to map sentiment, hash rate changes, and liquidity growth.
- Open macro-adjacent entries (banking headlines, policy shifts) to connect price to context, not just charts.
Regulation and institutional milestones
Rules and recognitions show up like mile markers: FinCEN guidance (2013), NYDFS BitLicense (2015), CBOE/CME bitcoin futures (Dec 2017), public-company treasuries entering (MicroStrategy’s first buy in Aug 2020), El Salvador making bitcoin legal tender (Sept 2021), and U.S. spot bitcoin ETFs gaining approval (Jan 10, 2024). Whether you cheer or groan, these entries explain why liquidity deepened and why headlines pulled in new audiences.
- Follow the futures launch entries to see how new hedging tools changed market structure.
- Open the ETF approval and legal tender entries to capture the institutional and sovereign steps that shifted adoption curves.
- Scan for enforcement actions and guidance to understand compliance turning points for businesses.
When you read the timeline this way—by chapter, with context—you don’t just memorize dates; you build intuition. But here’s the question that matters before you rely on it for research: does it get the details right and stay fresh when new milestones land fast? I stress-tested that next, and the answer might surprise you…
Is HistoryOfBitcoin.org accurate and up to date? My take
I use this timeline when I want a clean, reliable snapshot of Bitcoin’s biggest moments. For high-level research and teaching, it’s strong. For citation-grade detail, I still open the sources it links to and run a quick second check. That balance—speed first, precision on demand—is where it shines.
What it gets right
The site nails the basics that matter for trust:
- Chronology feels tight: You’ll see cornerstone dates lined up the way historians expect:
- Whitepaper: Oct 31, 2008 — Satoshi’s PDF is right here: bitcoin.org/bitcoin.pdf
- Genesis Block: Jan 3, 2009 — with the headline that framed the mission
- Pizza Day: May 22, 2010 — the Bitcointalk thread that made value tangible: bitcointalk.org/topic=137.0
- SegWit activation: Aug 24, 2017 — check the technical record: BIP141
- Taproot activation: Nov 14, 2021 — the canonical spec: BIP341
- Halvings: Nov 28, 2012; Jul 9, 2016; May 11, 2020; Apr 20, 2024 (block 840,000)
- Spot ETF approvals (US): Jan 10, 2024 — SEC statements: SEC Chair statement
- Links that teach: Entries tend to point at primary docs (BIPs, forum posts, court filings, reputable news). That makes verification fast.
- No fuzz, just signal: The focus stays on landmark moments—protocol upgrades, forks, exchange failures, regulatory moves, adoption milestones. It’s built for clarity, not clicks.
“The Times 03/Jan/2009 Chancellor on brink of second bailout for banks.”
That message in the Genesis Block isn’t just trivia—it’s context. The timeline does well to keep that spirit: date first, meaning second.
Gaps and limitations
It’s not perfect, and that’s okay—knowing the edges helps you use it right.
- Recency lag: Brand-new events can take a beat to appear. If a headline dropped this week, cross-check elsewhere while you wait.
- Scope is Bitcoin-only:Altcoin events show up only when they affect Bitcoin (e.g., 2017 Bitcoin Cash fork). That’s by design, but it means less context on wider crypto market shifts.
- Granularity is minimal: Complex sagas (2017 scaling debates, 2014 Mt. Gox fallout, 2020 “Black Thursday”) may be summarized in one or two entries. If you need the full story arc, you’ll want to open the linked sources.
- Link rot risk: Forum posts and old news links can move or disappear over the years. Most are fine, but it’s smart to capture a second source or use web archives when you cite.
- Time zones and exact timestamps: When precision to the minute matters (e.g., activation heights, soft fork lock-ins), confirm with chain data or BIPs.
How I cross-check when it matters
Here’s my quick playbook when I need bulletproof facts for a report, class, or newsroom brief:
- On-chain events: Verify block heights and dates using a trusted explorer (e.g., mempool.space) and the related BIPs or release notes.
- Example: Taproot activation at block 709,632 — confirm against BIP341.
- Protocol upgrades: Cross-check with the BIP itself and the Bitcoin Core release notes on GitHub.
- Market or exchange incidents: Pair a primary source with a major newsroom:
- Mt. Gox 2014: read a court or trustee document, then a wire report like Reuters.
- Regulatory milestones: Look for original government releases:
- SEC ETF approvals: link a timeline entry to the SEC statement: sec.gov.
- El Salvador 2021: confirm with a national announcement or a top-tier outlet like Reuters.
- Data context: When a claim touches mining or network distribution, compare with independent datasets:
- Cambridge Bitcoin Electricity Consumption Index: ccaf.io/cbeci
Two sources are usually enough—one primary, one independent. When I’m on deadline, that combo has saved me more than once.
Bias and scope
The tone is intentionally low-opinion. Selection bias exists (every timeline chooses what to highlight), but I don’t see agenda-setting or trading calls. It’s history-forward, not market-chatter. Expect some survivorship bias (biggest winners and disasters dominate) and headline bias (events with clear timestamps get priority). That’s fine—as long as you remember a timeline is a map, not the whole terrain.
“If you don’t believe me or don’t get it, I don’t have time to try to convince you, sorry.” — Satoshi Nakamoto
I keep that line in mind. The job of a good timeline isn’t to convince; it’s to point you at the right facts, fast.
Who should use it (and how)
- Students and beginners: Scan the eras, click the links, and keep a note of 10 “must-know” dates. It’s a perfect primer.
- Journalists and editors: Use it to anchor your chronology, then source original docs for quotes. No guesswork on dates.
- Educators: Pull entries into slides with the primary links. It reduces prep time while keeping rigor.
- Researchers and analysts: Treat it as scaffolding. Build depth with BIPs, Core release notes, court records, and datasets like CCAF.
When you’re under pressure, the last thing you want is 20 tabs and three different dates for the same event. This site helps you get to “correct” before you get to “complete.”
Want quick, copy-ready answers to the questions everyone asks about Bitcoin’s history—like who created it, when the halvings happened, and what caused the biggest crashes? Keep scrolling; I’ve bundled the most useful ones next.
FAQ: People also ask about Bitcoin history (and this site)
I get a ton of “quick one” questions about Bitcoin’s past. Here are fast, reliable answers you can copy into your notes, with pointers on how to confirm them on HistoryOfBitcoin.org and with primary sources.
Who created Bitcoin and when?
Satoshi Nakamoto published the Bitcoin whitepaper on October 31, 2008, and mined the Genesis Block on January 3, 2009. One famous detail you’ll often see highlighted:
“The Times 03/Jan/2009 Chancellor on brink of second bailout for banks”
That message is embedded in the Genesis Block’s coinbase data. Early posts from Satoshi on the cryptography mailing list and later on BitcoinTalk are essential primary sources—HistoryOfBitcoin.org points to many of them so you can read the originals.
What was the first real-world Bitcoin purchase?
Bitcoin Pizza Day — May 22, 2010. Laszlo Hanyecz paid 10,000 BTC for two pizzas arranged via a forum post. The original thread is still findable; it’s one of the cleanest “value left the lab” moments in tech history and a great anchor when you’re explaining early adoption.
What is the Bitcoin halving and why does it matter?
About every 210,000 blocks (~4 years), the protocol cuts the block subsidy in half. This throttles new BTC issuance on a fixed path toward the 21 million cap:
- 2009: 50 BTC → 2012: 25 BTC
- 2016: 12.5 BTC → 2020: 6.25 BTC
- 2024: 3.125 BTC (current era)
Halvings matter because they change the flow of new supply. While price is never guaranteed, major narratives and liquidity cycles have repeatedly formed around halving windows (2012–2013, 2016–2017, 2020–2021, and the post-2024 era). The timeline marks each halving, so you can frame market discussions by block height rather than just dates.
Why did Bitcoin crash in certain years?
There’s rarely a single cause. It’s usually a pile-up of weak foundations getting stressed. A few clear examples you can cross-check on the timeline:
- 2011: Early exchange fragility (including a Mt. Gox incident) and thin order books led to wild intraday swings.
- 2013–2014: Regulatory headlines and the Mt. Gox collapse drove one of Bitcoin’s first major bear cycles.
- 2018: Post-2017 bubble hangover, ICO fallout, and leverage flushing.
- March 2020: COVID liquidity shock (“sell everything” moment) hit risk assets broadly.
- 2022: Contagion from UST/Luna, 3AC, and FTX exposed leverage and custody risk.
When you see a drop on a chart, scan the same year on HistoryOfBitcoin.org. You’ll spot the catalysts right around it—exchange failures, policy moves, or broader macro shocks.
Is Bitcoin anonymous or pseudonymous?
Pseudonymous. Identities aren’t built into addresses, but transactions are public. Two well-cited studies show how activity can be analyzed:
- Meiklejohn et al., 2013 mapped flows and used clustering heuristics to study behavior.
- Biryukov, Khovratovich, Pustogarov, 2014 explored linking IP-level info to on-chain activity.
Real-world events on the timeline—like law-enforcement recoveries and exchange investigations—underline this: Bitcoin is traceable enough that poor privacy practices can reveal a lot.
Does HistoryOfBitcoin.org cover altcoins?
It’s Bitcoin-first. You’ll see other coins only when they intersect Bitcoin’s story—think forks, market structure changes, or policy moves that affected the whole crypto ecosystem.
Is the site free and safe to use?
Yes. It’s a simple, free timeline without noisy pop-ups in my experience. It loads fast, and I’ve used it on desktop and mobile without issues.
Can I cite it for school or work?
Use it as a map to primary sources. For formal citations, go to the original item the entry links to—Satoshi’s whitepaper, a BitcoinTalk thread, a BIP on GitHub, or a reputable news report—and cite that directly. That keeps your work bulletproof.
How do I verify what I see there?
- Open the linked source in each entry (whitepaper, mailing list post, BIP, commit, article).
- Check timestamps and author names; if it’s code, confirm the commit hash.
- Cross-check one independent source (another reputable outlet, archived page, or official repo).
- For on-chain events, look up the block height/txid on a trusted block explorer to confirm the exact time and details.
Does it include the latest milestones?
Major moments tend to appear—like SegWit activation (2017), Taproot (2021), spot Bitcoin ETF approvals in the U.S. (2024), and the 2024 halving. For very fresh news, I always peek at the current year and then cross-check with a second source if I’m publishing something that needs to be airtight.
Quick thought before we wrap: if a single page could give you the cleanest big-picture narrative without wasting an hour, would you keep it pinned? I’ll tell you exactly how I use that advantage next.
Verdict: Should you use HistoryOfBitcoin.org?
If you want a clean, fast way to get your bearings on Bitcoin’s story without slogging through noise, yes—this timeline is absolutely worth using. It gives you the big picture, helps you find the right moment in seconds, and points you to sources you can verify. That’s exactly what a timeline should do.
In practice, it’s great for answering questions like “When did SegWit activate?” (August 2017), “When did Taproot go live?” (November 2021), or “Where do halvings sit relative to big market shifts?” You can spot those anchors quickly and then jump to the linked source for details. It’s quick, it’s tidy, and it helps you avoid getting lost in side quests.
And yes, there’s a reason timelines work. Clear chronological structure reduces cognitive load and makes scanning easier—something usability research has shown for years in how people read on the web. You get the context without the clutter, which is exactly what you want when you’re fact-checking or teaching.
Who will love it
- Beginners who want to understand the arc from whitepaper to today without jargon.
- Educators building lesson slides on milestones like SegWit (2017), Taproot (2021), and the halving rhythm.
- Analysts who need quick historical context to frame charts or narratives.
- Journalists on deadline who need a timestamped event and a credible link fast (e.g., Pizza Day, Mt. Gox fallout, major enforcement actions, ETF approvals).
Who might need more
If you need deep data or technical granularity, you’ll want to pair the timeline with specialized resources:
- Active traders: Price and order book analytics from dedicated market platforms.
- On-chain researchers: Metrics dashboards and mempool explorers for fee markets, UTXO age, and supply distribution.
- Protocol wonks: Original BIPs, Optech newsletters, and core client release notes for the full technical picture.
- Academic work: Primary documents and peer-reviewed papers for citations.
Quick action steps
- Bookmark HistoryOfBitcoin.org for fast reference.
- Scan the eras that matter to your project: origins, halvings, forks, upgrades, regulatory moments.
- Open the linked source on any entry you plan to cite—then confirm with a second reputable source.
- Build a simple research workflow: timeline → primary source → secondary corroboration → your notes.
- Keep a short list of “anchor events” you always check: Genesis Block, Pizza Day (2010), Mt. Gox (2014), SegWit (2017), Taproot (2021), each halving, major regulatory decisions.
My call
Use this timeline as your go-to starting point for Bitcoin’s story. It’s clear, fast, and perfect for getting context before you dig in. Treat it like a map, not the entire hike: frame the moment here, then expand with the primary documents it links to when you need depth.
“Start with the map, then pick your trail.”
If you notice a gap, jot it down and check back—good timelines are living projects. For most learning and research needs, this one hits the sweet spot between speed and substance.