santiment Review

santiment
medium.com
Santiment Review Guide: Everything You Need to Know + FAQ
Is Santiment actually worth your time and money—or just another set of pretty charts? If you’ve ever asked that while skimming a Santiment Medium post, you’re in the right place.
I review crypto tools every day for CryptoLinks, and I’m going to show you how I use Santiment’s data—and their Medium breakdowns—to spot smarter entries, avoid traps, and build conviction when the market is loud and messy.
Quick story: In late 2023, I saw a Santiment Medium post flagging rising exchange inflows and overheated MVRV on a trending alt. Price was still grinding up, but the combo screamed “risk.” I skimmed the freshest crypto news. A week later, it pulled back ~18%. That’s the difference between guessing and acting with a framework.
The problem: too much noise, not enough clarity
Crypto throws a firehose of charts, takes, and narratives at you—often pointing in opposite directions. On-chain and sentiment data can be powerful, but two things get in the way:
- Signal selection: Which metrics actually move markets? Active addresses? Exchange inflows? MVRV? Weighted sentiment? Not all matter equally in every phase.
- Timing and context: A social spike or whale wallet move can be early, late, or irrelevant—until you put it next to price structure and funding.
It’s no surprise most traders either overfit to one shiny indicator or give up and go back to raw price/volume. That’s leaving edge on the table. Research has long shown crowds can be useful at extremes (think Twitter mood vs. market turns, or retail euphoria before tops), but only when you frame it right and wait for confluence. Santiment’s edge is turning that framing into something you can actually repeat.
My promise: a simple, practical Santiment playbook
I’ll keep this dead simple and actionable. You’ll see how I read Santiment’s Medium posts and convert them into setups I can monitor inside Sanbase without babysitting charts all day.
- Which metrics matter most for risk-on vs. risk-off environments
- How to copy a Medium case study into your own chart stack
- When to act vs. wait using basic guardrails (confirmation, invalidation)
- How to set alerts so the right conditions come to you
Expect clear examples and no magic-indicator hype. Some metrics lead, some lag, and some are just noise—your job is stacking the ones with the best odds for your timeframe.
Example you’ll recognize: “Top word” spikes and euphoric social volume around major resistance often line up with local tops. Pair that with positive funding and rising exchange inflows? That’s a 3-alarm system I don’t fade lightly.
Who this guide is for
- Swing traders who want early warnings on rotations and squeeze risk
- Long-term investors who use on-chain health and dev activity to build conviction
- Researchers/analysts who need repeatable, data-backed narratives—not vibes
If you want fewer random trades and more controlled bets, you’ll feel at home here. If you just want 10 inbound “alpha” calls a day, this isn’t that.
What you’ll walk away with
- A clear view of Santiment’s strengths and limits: where it shines (whale moves, exchange flows, crowd behavior) and where caution helps (small-cap noise, lag in some metrics)
- How to read their Medium posts with intent: translate narrative into a trackable setup, not just a nice read
- A fast-start checklist: rebuild charts, set three alerts, and review weekly with a simple journal
- Answers to the questions you keep Googling: accuracy, free vs. Pro, API, and how to actually use MVRV and social spikes
One more promise: I’ll show you where people go wrong. Chasing every social surge. Treating MVRV like a buy/sell button. Ignoring higher timeframes. You’ll sidestep those with a two-metric minimum rule and clean invalidation.
Ready to cut the noise and turn Santiment’s Medium into a real workflow you can run in minutes?
Quick thought: ever notice how the same metric looks genius one week and useless the next? In the next part, I’ll unpack where people go wrong with these tools and how to set guardrails so you don’t fall into the usual traps. Which mistake do you think costs traders the most?
What Santiment is—and why their Medium matters
Quick snapshot of Santiment
Santiment is a crypto analytics platform that blends on-chain activity, social sentiment, and development data into one toolbox. In practice, that means I can check things like exchange inflows/outflows, MVRV, active addresses, whale-sized transactions, funding rates, social volume and weighted sentiment, plus GitHub activity—all in the same place (inside Sanbase) or via their API.
Why does this matter? Because these aren’t just “interesting charts.” They help me answer questions price alone can’t:
- Are coins moving to exchanges? That can signal looming sell pressure or hedging behavior.
- Is the crowd euphoric or exhausted? Spikes and weighted sentiment often mark emotional extremes.
- Who’s active under the hood? Consistent GitHub commits hint at real building versus one-off hype.
- Is profit-taking getting risky? MVRV helps frame whether holders are heavily in profit (and likely to sell) or underwater (and more patient).
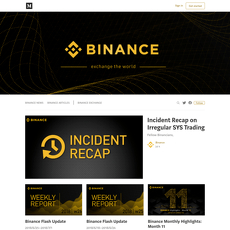
I’ve seen this stack prevent classic mistakes. For example, when price drifts up while exchange inflows rise and MVRV sits high, I dial back risk. When price chops sideways but whale transactions rise and social attention is quiet, I start hunting for asymmetric entries. Santiment has published multiple case studies on these dynamics on their Medium, and they regularly back observations with historical ranges users can replicate in Sanbase.
“Data beats drama. Every. Single. Time.”
The role of the Santiment Medium
Santiment’s Medium is thoughtful, thoughtful analysis built for decision-makers—founders, DAO stewards, protocol designers, and serious learners. Posts often walk through recent moves (for Bitcoin, ETH, or mid-caps), point out anomalies (like unusual whale behavior or social narrative spikes), and then show the exact indicators behind the conclusion—so I can rebuild the same view inside Sanbase in minutes.
What I look for in their write-ups:
- Replicable setups: Clear screenshots and metric names I can chart 1:1 in Sanbase.
- Context bands: “This indicator tends to be high/low relative to its 1y range.” That context stops me from overreacting.
- Cause vs. coincidence: Posts that connect on-chain flows or sentiment shifts to plausible behavior (profit-taking, narrative rotations), not hindsight hype.
A common pattern they highlight: price grinds higher, but social volume for the asset barely moves while whale transactions tick up. That “quiet climb” with smart money activity can be healthier than a move fueled by retail euphoria. On the flip side, they’ll flag when crowd excitement runs hot while exchange inflows quietly increase—great for tightening stops or waiting for better entries.
If you’re skeptical of sentiment charts (I was), their Medium helps by showing before/after sequences and historical comparisons you can verify yourself. It’s not about calling tops and bottoms; it’s about framing risk so you’re not guessing. I especially value posts where they combine two or three signals, because confluence tends to travel better than any single metric.
Who gets the most value
Santiment’s Medium shines for people who want leading context—not just colorful indicators:
- Swing traders: Early warnings from exchange flows, funding, and crowd sentiment can hint at squeezes or distribution before price confirms.
- Long-term investors: MVRV ranges and development activity help separate conviction holds from hopium, especially during long chops.
- Analysts and researchers: Cross-asset comparisons, anomaly spotting, and repeatable workflows make it easier to build and test a thesis.
If you’ve ever bought because Crypto Twitter screamed “send it,” and then watched the rug get pulled, you’ll appreciate how their posts cool the emotion and give you a checklist. It’s like having a calm voice that says, “Here’s what the chain is doing. Here’s what the crowd is saying. Decide accordingly.”
Want to know the exact indicators I see most often in those posts—and how I read them without overthinking? Keep going; next, I break down the core metrics you’ll see on Santiment’s Medium and how I use each one to avoid the usual traps.
The core Santiment metrics you’ll see explained on Medium
“In crypto, the crowd screams at tops and whispers at bottoms. Data helps you hear the whisper.”
On-chain activity that signals risk and opportunity
These are the “heartbeat” metrics I watch when I’m trying to figure out if a move has real fuel or if it’s just noise.
- Active Addresses: A steady climb in unique active addresses tends to precede sustainable uptrends. Spikes often track news and fade fast. I like to see higher lows in active addresses even when price ranges—quiet accumulation.
- Transaction Volume: Rising on-chain volume alongside price is healthy; price up while volume flat is a yellow flag. If volume spikes while price dumps, that can mark forced selling and potential capitulation.
- Exchange Inflows/Outflows:
- Inflows up = potential sell pressure (tokens moving to exchanges often get sold).
- Outflows up = potential accumulation (moving off exchanges to cold wallets reduces immediate supply).
- Whale Behavior: Large holders clustering buys on dips or pulling coins off exchanges after a wick is one of my favorite “risk-on” signals. Clustering deposits to exchanges near local highs? I start thinking distribution.
Real-world flavor: on multiple chaos days (think March 2020 and the broader 2022 washouts), exchange inflows spiked hours before the heaviest sell-offs. On the flip side, persistent outflows in the weeks after those events mapped to slow, stubborn recoveries. Santiment’s Medium breakdowns often show these patterns with clean historical context.
MVRV and crowd positioning
MVRV compares the market price to the average price at which coins last moved (realized price). It tells you how “in profit” recent holders are, which translates to how itchy they might be to sell.
- 30D MVRV: Great for swing windows. When it pushes above roughly +15–20%, I expect more profit-taking risk. When it dips below around -10–15%, I start scouting re-entries.
- 365D MVRV: Slower, conviction layer. Deep negatives here have historically lined up with value zones in major assets.
- Stacking MVRVs: My favorite read is when 30D is washed out while 365D trends up—that’s short-term pain inside a healthier long-term picture.
MVRV isn’t magic, but it frames expectations. If price is ripping and 30D MVRV is already hot, I tighten risk. If sentiment is awful and 30D is deep red, I stop being cute with shorts.
Social and sentiment analytics
When the crowd gets loud, I listen—but I don’t blindly follow it. Santiment’s social suite is built for that balance.
- Social Volume: How often an asset is mentioned across crypto social platforms. Spikes are attention magnets; I compare them to price and funding to see if it’s froth or fear.
- Weighted Sentiment: A blend of volume and tone. Big positive readings near resistance feel like euphoria; big negative near support feels like capitulation.
- Trending “Top Words”: When words like “clever”, “moon”, or “lambo” top the board into a rally, I get cautious. When I see “scam”, “dead”, “rug” after a bleed-out, I start hunting reversals.
There’s real science behind this: multiple studies have shown that crowd mood can lead short-term price moves in digital assets and traditional markets. What matters is context—pair the social spike with structure, funding, and on-chain flows, and it goes from trivia to edge.
Development activity and project health
Hype can pump a chart, but consistent development activity helps me stay in a position when the noise gets loud. Santiment tracks public GitHub events across a project’s repos to reduce obvious vanity commits.
- Consistency > bursts: I’m more impressed by a flat, steady cadence of commits than by one explosive week.
- Trend vs price: If dev activity trends up while price chops or drifts down, I avoid panic even if the 4H chart looks wild. It often precedes the next narrative wave.
- Cross-check: I still scan whether the repos are the main ones and not forks. The metric is one signal—not a verdict.
For mid- to long-term positions—especially in mid-caps—this has saved me from chasing shiny narratives with empty roadmaps.
Funding rates and market structure
Perp markets broadcast the crowd’s positioning. I treat funding and open interest like an X-ray for squeeze risk.
- Funding Rate:
- Positive and climbing into resistance = longs crowded, squeeze risk up.
- Negative and grinding while price holds = shorts paying to be wrong, shorts squeeze fuel building.
- Open Interest (OI):
- OI rising + flat price = spring coiling. Add funding context to guess direction.
- OI flush after a wick = leverage cleared; levels get cleaner for spot-driven moves.
One pattern I respect: negative funding + rising OI + social negativity. If price isn’t breaking down, I prepare for the “why did it rip?” tweetstorm.
Alerts, screeners, and watchlists
You don’t need to babysit charts. Santiment’s alerts let you catch the outliers without missing sleep.
- Whale alerts: Set triggers for large on-chain transfers or exchange inflows for your top assets. Example: alert when a single wallet moves >$5M to an exchange.
- Exchange flow anomalies: Get pinged when net inflows/outflows hit a 30-day z-score threshold. Sudden spikes matter more than absolute numbers.
- Social alerts: Alert on social volume surging beyond a rolling average. I pair this with a weighted sentiment threshold to filter euphoria vs fear.
- MVRV thresholds: Predefine your “danger” and “opportunity” zones for 30D and 365D. Let the system tap you on the shoulder, not the other way around.
My simple starter watchlist pairs one top cap, one mid-cap, and one niche asset. Each gets four alerts: exchange inflow spike, exchange outflow spike, social buzz surge, and MVRV crossing my preset lines. That alone catches most of the “stop scrolling, pay attention” moments.
If these reads feel powerful but a bit abstract, good news: next, I’ll rebuild a real chart stack and show the exact conditions I use—want to see how I turn these into a repeatable, 10-minute workflow you can copy today?
How I actually use Santiment step-by-step
Start with a thesis from a Medium post
I always begin with a simple hypothesis borrowed from a fresh Santiment Medium post. I’m not trying to predict the future—I’m trying to test a repeatable setup.
Example thesis I’ve used more than once: “If 30D MVRV enters a high-risk zone while exchange inflows spike and social volume turns euphoric, odds of a local top increase.” That recipe came from multiple Santiment breakdowns of Bitcoin and ETH tops. I write it down before I ever open a chart.
“Clarity beats prediction. Give me a rule I can follow over a hunch I can’t repeat.”
How I extract the thesis from a post:
- Assumptions: e.g., “Assumptions: active voters exist, liquidity will stay if incentives change”
- Mechanism: e.g., delegation > direct voting for complex proposals
- Predicted outcome: e.g., fewer proposals, higher completion rates
Real-world sample I logged: after a Santiment piece flagged “overheated 30D MVRV + inflow anomaly” on BTC in early 2023, I treated a 12–15% pullback as base case and reduced risk. The move didn’t happen overnight, but the cooling came within days. That’s the power of a clear trigger, not guesswork.
Rebuild the chart stack in Sanbase
Next I recreate exactly what the article showed, inside Sanbase. No shortcuts; I want an apples-to-apples read.
My baseline stack:
- Price (candles) + volume
- Exchange inflow/outflow (spot sell pressure vs accumulation)
- 30D and 365D MVRV (short-term vs cycle positioning)
- Social volume + weighted sentiment (are we euphoric or fearful?)
- Whale transactions (e.g., ≥ $100k/$1M swaps) and active addresses
- Development activity (sanity check for mid-term)
What I look for:
- Echoes of the case study: Does my asset show the same preconditions the post highlighted?
- Magnitude, not noise: Is MVRV just elevated, or in the historical danger zone? Are inflows anomalous or typical?
- Narrative alignment: Do “top words” in Santiment’s social feed match what price is reacting to?
Quick example from my notes: on SOL late 2023, I saw rising active addresses + neutral-to-negative funding while social volume was steady—not euphoric. That echoed a Santiment framework: quiet network strength + non-crowded positioning often precedes trend continuation. I sized in with a clear invalidation instead of chasing green candles.
If you like evidence, you’ll appreciate that this approach lines up with independent findings that social extremes tend to precede volatility, while on-chain pressure (like exchange inflows) skews short-term direction. Santiment’s own Medium has multiple backtests on MVRV ranges leading to mean reversion; I use those historical bands as my “context rails.”
Set alerts for your key conditions
I don’t sit and babysit charts. I let alerts do the work.
My standard alert pack:
- Exchange inflows: Trigger when inflow z-score > 2 on a 90-day lookback. Translation: unusually heavy coins hitting exchanges.
- 30D MVRV: Ping when it crosses into my pre-defined risk band (e.g., top 20% of last year) or opportunity band (bottom 20%).
- Social: Alert when today’s value > 95th percentile of the last 60 days or when “top words” show euphoric keywords (e.g., “moon,” “ATH”).
- Social spike: Alert when social volume Z-score > +2 or when MVRV hits an extreme (euphoria or fear).
Execution tips:
- Choose delivery that interrupts you: Telegram, email, or webhook—whatever you’ll actually see.
- Bundle alerts by intent: One pack for “risk off,” another for “accumulate/scale,” so you don’t freeze when pings arrive.
- Throttle duplicates: Cooldown windows prevent alert fatigue during fast markets.
Case in point: an ETH alert sequence I use is “MVRV high-risk + inflow spike + euphoric social.” When all three fire within 48 hours, I stop adding risk and look to trim into strength. When I get “MVRV opportunity + negative weighted sentiment + falling exchange balances,” I prep bids instead of doomscrolling.
Validate across timeframes
This step keeps me from overreacting to one hot signal.
- Top-down first: I check weekly 365D MVRV and exchange balances for the big picture. If higher timeframes aren’t stretched, I avoid panic even if the 4H chart looks wild.
- Daily for structure: Is price in a clear uptrend or range? I won’t fade strength with a full-size short just because MVRV pinged high for a day.
- 4H/1H for timing: I look for the smaller trigger—bearish divergence on social euphoria, inflow climax, or a funding squeeze setup.
Position sizing rule I actually follow: if weekly + daily agree with my alert pack, I go full size. If they conflict, I go half or stand aside. Waiting has saved me more money than any brilliant entry.
Journal and iterate
If a signal isn’t written down, it’s just a feeling. I keep it mechanical.
- Screenshot the stack: Price + each metric pane at the moment of decision.
- Note the thesis: Which Medium playbook did I copy? What exact thresholds fired?
- Predefine invalidation: The line that proves me wrong—no debating later.
- Outcome review (weekly): Did the combination actually precede the move, or did I cherry-pick? What gets promoted or demoted in my alert pack?
My template (steal it):
- Setup name: “MVRV High + Inflow Spike + Euphoria”
- Asset/TF: ETH, Daily/4H
- Triggers fired: 30D MVRV > 85th pct, Inflows z-score 2.3, Social 95th pct
- Action: Trim 25%, stop add risk
- Invalidation: Breakout with inflows normalizing and sentiment calming within 72h
- Result: Pullback -8.7% within 4 days; re-added on reset
- Lesson: Add whale tx spike as extra confidence next time
Over time, this turns “interesting charts” into a ruleset. And that’s the point—consistency beats genius.
Quick thought before you set this up: which of these alerts and metrics are available for free, and which require a paid tier? I’ve tested the limits—want the clean breakdown so you don’t overpay or miss a key feature?
Pricing, plans, and what’s free vs paid
Free features
If you’re just getting your feet wet, the free access is a solid way to learn the rhythm of Santiment’s metrics and recreate the basic setups you see in their Medium posts.
- Core metrics, limited scope: You can check essentials like active addresses, social volume, and basic exchange flows on major assets.
- Shallow history: Enough recent data to understand current context, not enough to stress-test ideas across cycles.
- Discovery without commitment: Build simple chart stacks, see “top words” on social, and practice reading on-chain vs. price.
Real example: I tracked a “social euphoria” moment on a large-cap and saw price stalling after a sudden spike in weighted sentiment. On the free tier, I could confirm the short-term shift, but I couldn’t scroll back far enough to see how similar spikes played out during the last two market regimes. That missing history matters when you’re trying to separate a blip from a true turning point.
“What gets measured gets managed.” — Peter Drucker
Free is perfect for picking a metric or two and learning how it behaves in the wild. When you want evidence across years and across assets, you’ll hit the paywall—and that’s usually the right time to level up.
Pro and higher tiers
This is where Santiment becomes a practical edge, not just a learning tool.
- Deeper history: Scroll back through prior cycles to see how MVRV extremes, whale inflows, or social panics resolved before. Patterns stop being opinions when you can actually compare outcomes.
- Broader asset coverage: Mid- and small-caps come online, which is crucial if you hunt for rotation plays and early narrative leaders.
- Custom alerts that matter: Set triggers for exchange inflows, whale transactions, or MVRV lines in the sand. Get pinged when risk or opportunity turns from “interesting” to “actionable.”
- Advanced metrics unlocked: Go beyond the basics with metrics that help you spot distribution, capitulation, and crowd FOMO with much better timing.
- Exports and saved workflows: Keep your chart stacks, reuse them, and move snapshots into your journal for faster iteration.
Sample workflow I use: set an alert for “exchange inflow anomaly” on ETH, pair it with a social spike alert, and wait for both to trigger within a short window. If they do, I check MVRV and price structure before making any move. Without Pro-level alerts and history, that three-check system is hard to run in real time.
Tip: pricing can change, so I always check the current page before subscribing: Santiment pricing.
API and data access
If you like spreadsheets, Python, or dashboards, the API turns Santiment into your own data feed.
- GraphQL endpoint: Pull exactly the metrics you need—MVRV, funding rates, social volume, exchange flows—without lifting the whole kitchen sink.
- Backtesting and automation: Recreate rules like “enter when MVRV drops below a threshold and funding flips negative; exit on whale outflows + social euphoria.” Test across multiple assets and periods.
- Flexible outputs: Push into Jupyter, Google Sheets, or your favorite BI tool to monitor dashboards and tweak models on the fly.
Why I like the API for serious work: it cuts “chart bias.” When you test the same rule on 20 assets and two cycles, the data tells you if a setup is real or just a pretty screenshot. Docs are easy to follow, and you can start with a single metric to keep it simple: SanAPI documentation.
Value for different users
- Active traders:
- Why pay: Timely alerts and anomaly detection save screen time and help you avoid chasing tops.
- What to set up: Whale transaction alerts on your watchlist, exchange inflow anomalies, social euphoria/fear spikes, and MVRV “danger zones.”
- Investors:
- Why pay: Deeper history builds conviction. You can see how long-term holders behaved in previous cycles and when “value” actually got rewarded.
- What to track: MVRV ranges across cycles, development activity for durability, social sentiment to avoid getting swept into herd behavior.
- Researchers and quants:
- Why pay: API and advanced metrics let you test hypotheses quickly and publish repeatable frameworks.
- What to build: Event-driven models that combine on-chain flows + sentiment + funding, with rules you can verify over years—not days.
Value comes down to one thing: does the plan shorten the time between “I think something’s happening” and “I know what to do next”? When your alerts fire at the right moments and your history confirms the pattern, that’s when a subscription pays for itself.
Quick reality check: Free is great for practice and simple reads. If you want to act with confidence, you’ll want the history, alerts, and advanced metrics—especially when the market turns fast.
One more thing before we keep going—ever notice how the same metric looks genius one week and useless the next? In the next part, I’ll unpack where people go wrong with these tools and how to set guardrails so you don’t fall into the usual traps. Which mistake do you think costs traders the most?
Accuracy, limits, and common mistakes I see
What Santiment does well
When something weird is brewing under the hood, Santiment usually spots it early. The magic isn’t a single metric—it’s how the data clusters. A few patterns I trust:
- Whale and exchange flows as an early nudge: Unusual inflows to exchanges often precede accelerated sell pressure. I’ve seen this give a 12–36 hour head start before the narrative catches up, especially on majors like BTC and ETH.
- Social “word clouds” flag regime shifts: Big spikes in attention and euphoric wording frequently precede local tops, while heavy fear/apathetic lulls show up near bottoms. Independent research has also tied attention/sentiment surges to future volatility in crypto and other markets.
- MVRV brackets risk: I use 30d and 365d MVRV bands as context—stretched positive values = elevated profit-taking risk; deep negatives = better re-entry zones. Not a signal by itself, but a strong temperature check.
- Dev metrics for conviction: Consistent GitHub commits are a sanity check for mid-term. Santiment tracks public GitHub events across a project’s repos to reduce obvious vanity commits.
“Markets don’t yell when they’re tired; they whisper.”
On that front, Santiment’s anomaly alerts and historical baselines help me hear those whispers before they turn into headlines.
Where people go wrong
- Chasing every spike: A single social surge or exchange inflow isn’t a trade. Without trend and context, you’re just reacting to noise.
- Ignoring higher timeframes: If daily structure is down and you’re taking every bullish 5-minute sentiment blip, you avoid panic even if the 4H chart looks wild.
- Overfitting one anecdote: “It worked last week” is not a strategy. Markets change regimes; your read needs to adapt.
- Misreading flows: Not all “inflows” are sell intent. Internal exchange reshuffling and wallet labeling delays can fool you if you don’t cross-check.
- No invalidation: Metrics can be early or wrong. If you can’t find “I’m out if X,” you’re not using data—you’re gambling.
There’s also a behavioral trap the data can’t fix for you: confirmation bias. If you show up wanting a long, you’ll find a long. I’ve been there. The solution is rules, not opinions.
Data quirks to keep in mind
- Lag and labeling: On-chain tags aren’t perfect. Some whale/exchange addresses are identified later, and big internal transfers can pollute “flow” reads for a few hours.
- Small caps are loud: A few active addresses can swing metrics dramatically. Treat microcaps’ on-chain and social spikes as “suggestive,” not decisive.
- Social noise and bots: Weighted sentiment helps, but trending words tend to arrive after fast moves. It’s better as a contrarian check than a trigger.
- Dev metrics aren’t equal: Commits can be mirrored or trivial. I look for sustained activity across core repos, not one repo with bursty commits.
- Derivatives coverage differs: Funding/open interest can vary by venue and time zone. Use percentiles and multi-exchange averages instead of absolute levels.
- “Early” can feel wrong: On-chain warnings sometimes lead price by days. If you can’t sit through the lag, size down or wait for market structure to confirm.
If you like receipts, there’s plenty of research showing why attention/sentiment matters in crypto. One well-known paper found investor attention is a significant driver of crypto returns in the short run—useful context for how social and on-chain buzz can front-run moves.
My guardrails
Here’s how I keep myself honest when using Santiment data:
- Confluence rule: I want at least two non-overlapping confirms. For example, 30d MVRV stretched + social euphoria spike, or exchange inflows + rising funding.
- Percentiles over absolutes: I compare a metric to its own 90-day or 365-day history. “Top 10% inflow day” beats “big number on a chart.”
- Structure first, metrics second: I only act when on-chain/sentiment aligns with higher-timeframe market structure. No alignment, smaller size or no trade.
- Hard invalidation: If price reclaims/loses a key level or the signal breaks (e.g., inflows fade and funding normalizes), I exit. No debate.
- Regime tags: I label the environment as risk-on, choppy, or risk-off. The same spike means different things in each regime.
- Social cross-check: For sell-risk reads, I also check stablecoin exchange flows. Fresh stablecoin deposits with social FOMO can precede blow-off tops.
- Social review: I log failed signals and refine alerts. If one metric keeps lying to me in a specific asset, I de-prioritize it.
Example guardrail in action: if BTC 30d MVRV pushes above a historically hot zone, funding stays positive and rising for 24–48 hours, and exchange inflows print a 90th-percentile day, I tighten risk or hedge. If any of those unwind quickly, I stand down.
Bottom line: the data is strong, but it’s not a crystal ball—think edge, not certainty. Want the straight answer on whether the platform itself is legit, safe, and how accurate these signals really are across markets? I’ll tackle those questions next, no fluff—what’s the first thing you want cleared up?
FAQs: real questions people ask on Google
Is Santiment legit and safe to use?
Yes. Santiment has been around for years, cited by analysts, funds, and retail traders who care about on-chain and social data. Their stack (on-chain + sentiment + dev activity) shows up in research threads across Crypto Twitter and industry reports.
Safety is on you too:
- Enable 2FA and use a unique, strong password.
- Keep API keys private, rotate them if you suspect exposure, and don’t share screenshots with keys visible.
- Revoke app access you don’t use. Keep it tight.
“In crypto, trust the data—but protect the keys.”
Is Santiment free? What do I get with Pro?
There’s a free tier to learn the interface and test workflows. If you’re active, Pro is where it clicks.
- Free: Limited metrics and history. Great for learning the basics and following along with their Medium breakdowns.
- Pro and up: Deeper history, more assets, custom alerts, advanced metrics (multiple MVRVs, weighted sentiment, whale flows), and API access.
Quick rule: if you make or protect at least one decent trade a month from the alerts and context, Pro pays for itself.
How accurate are Santiment’s sentiment and on-chain metrics?
They’re excellent context—especially at extremes—but they’re not magic signals. I look for confluence instead of single-metric trades.
- MVRV extremes often line up with mean-reversion bounces or cool-offs.
- Exchange inflow spikes can precede sell pressure, particularly when price is extended and social euphoria is high.
- Weighted sentiment tends to invert at emotional extremes (euphoria at tops, despair near local bottoms).
Real-world feel: Santiment has shared multiple case studies on Medium where combinations of 30d/365d MVRV percentiles and social volume extremes coincided with turning points. Not every blip matters. The more signals that align, the better.
Does Santiment have an API?
Yes. You can query metrics programmatically and slot them into Python, spreadsheets, or dashboards.
- Docs: SanAPI overview
- App: Sanbase
- Use cases: backtest MVRV thresholds, automate alerts, or create custom watchlists that ping you when social volume crosses your rule.
How do I read MVRV, exchange flows, and social spikes?
I keep it simple and rules-based so I don’t get emotional.
- MVRV (30d and 365d):
- High positive = holders in profit; rising risk of profit-taking if price stalls.
- Deep negative = holders underwater; better odds for mean reversion if selling pressure fades.
- My baseline: 30d MVRV > ~+15–20% = caution zone; < ~-10–15% = potential opportunity zone. Ranges vary by asset liquidity and volatility.
- Exchange inflows/outflows:
- Inflows spikes = potential sell pressure (tokens moving to exchanges).
- Outflows spikes = potential accumulation or reduced sell overhang (tokens leaving exchanges).
- Match it with price reaction. If inflows spike but price holds, that’s relative strength.
- Social volume and weighted sentiment:
- Sudden buzz on “to the moon,” “ATH,” or trendy tickers often marks late FOMO.
- Fear-heavy language (“rug,” “dead,” “scam”) near multi-week support can mark exhaustion.
- I cross-check with top words on Santiment to see if a new narrative is actually spreading beyond a bubble.
Example you’ll recognize: during memecoin frenzies, social volume explodes while 30d MVRV for the hot tickers rips positive. When exchange inflows join the party, the cool-off risk skyrockets. That combo has saved me from chasing tops more than once.
Santiment vs Glassnode, CryptoQuant, Nansen, LunarCrush—what’s different?
Santiment stands out for combining on-chain + social + dev in one place and then teaching you how to use it with practical write-ups on Medium. That blend makes it my go-to for idea discovery and confirmation.
That said, other tools shine in niche areas: pure exchange flow granularity, deeper derivatives, or wallet-level forensics. I often pair tools for full coverage without bloating my stack.
“Data doesn’t predict; it prepares.” Use the right tool for the right question.
Can beginners use Santiment?
Absolutely. Start small. Copy what already works, then expand.
- Pick one asset you follow.
- Track three metrics: 30d MVRV, exchange inflows, and social volume.
- Set alerts: MVRV crosses your thresholds, inflow spikes, and social surges.
- Screenshot, journal, and review weekly. You’ll spot your own patterns fast.
Tip: when a Santiment Medium post matches what you see on your chart stack, that’s your green light to pay attention.
Curious when I reach for Santiment versus Glassnode, CryptoQuant, Nansen, or LunarCrush—and which combo I actually keep? I’ll show you my lean, real-world stack next. Which signal would you never give up first: social context or pure on-chain flow?
Santiment vs alternatives: when to use what
When Santiment is my pick
I reach for Santiment when I need a single screen that blends social chatter, on-chain flows, and developer activity into a clean narrative. That combo shines when markets pivot on sentiment as much as liquidity.
- Narrative shifts and crowd behavior: When a sector suddenly trends (AI, RWA, memecoins), I use social volume and weighted sentiment to see if the crowd is overheating or asleep. If buzz spikes while whales start sending tokens to exchanges, I treat it as caution territory.
- Whale footprints without noise: Santiment’s exchange inflows/outflows and whale transaction counts help me spot potential distribution or quiet accumulation—especially effective on mid- and large-caps.
- Conviction building: For longer holds, consistent development activity separates hype from builders. It won’t pump the chart tomorrow, but it helps me stop selling winners too early.
- Fast context + alerts: I want anomaly alerts across multiple data types (on-chain + social) without babysitting charts. Santiment’s alerting and easy chart stacks save me time.
Quick read: Academic work has shown social activity moves with crypto returns. Papers like Garcia & Tessone (2014) and Kristoufek (2013) found that social and search interest can foreshadow volatility and trend strength. That’s the lane where Santiment’s social + on-chain blend pays off.
Example play: Social volume spikes on a mid-cap while weighted sentiment turns euphoric and exchange inflows tick up. I’ll trim risk, wait for a cooldown in social and a reversal in flows, then look to re-enter when sentiment normalizes and whales stop depositing. Simple, repeatable, and based on confluence—not hope.
When another tool fits better
No single platform covers every edge case. Here’s when I complement or temporarily switch:
- Entity-level labeling and wallet maps: If I need to know who is moving funds (VCs, exchanges, smart money), I use tools with deeper address labeling.
- DeFi positions and protocol health: For collateral, TVL flows, and cross-chain DeFi risk, dashboards give me a clearer breakdown.
- Derivatives, funding, and options skew: When the trade hinges on leverage extremes or gamma risk, I check for funding, OI, and options metrics in more depth.
- Bitcoin UTXO and macro on-chain granularity: If I need cycle-level reads—realized cap cohorts, LTH/STH supply, or dormancy—other tools often go deeper.
- Exchange-level reserves and miner behavior: For exchange-specific inflows/reserves and miner flows, a companion is a strong companion.
- NFT wallet behavior: If the setup hinges on NFT wallets or marketplace activity, I’ll pull dedicated NFT analytics.
- Custom research and one-off questions: For ad hoc queries and community dashboards, or research help me validate or falsify a thesis fast.
Real-world scenario: Let’s say funding is sky-high and social is euphoric. I’ll confirm the leverage side with Laevitas/Coinalyze, then lean on Santiment alerts for any exchange inflow jump or social volume blow-off to time trims. The first tells me where the spring is wound; the second tells me when it might snap.
Smart stack approach
I keep the stack lean. Too many tabs lead to decision paralysis. Here are three stacks I actually use:
- Active trader: Santiment (alerts + social/on-chain) + Laevitas or Coinalyze (derivatives) + TradingView for execution. Two confirms before I act.
- Swing/investor: Santiment (MVRV, dev, flows) + Glassnode or CryptoQuant (macro on-chain/flows) + TradingView. Great for cycle reads and trim/add decisions.
- Research/quant: Santiment API (programmatic metrics) + Dune (custom queries) + DefiLlama (protocol context). Backtest the logic and automate alerts.
Checks I run before acting:
- Is there confluence between Santiment’s social/on-chain signals and a second data source?
- Is the setup aligned on a higher timeframe, not just a noisy 4H spike?
- Do I have a clear invalidation level if the data flips?
For discovery and timing, Santiment tends to be my first screen. For entity labeling, extreme leverage reads, or granular UTXO cycles, I pair it with a specialist. That balance keeps me fast without losing depth.
Extra reading
I keep regularly updated lists of crypto analytics and sentiment tools on CryptoLinks, and I post practical playbooks on CryptoLinks News. If you’re comparing Santiment vs Glassnode, CryptoQuant, Nansen, or LunarCrush, those pages will save you time.
Want the exact 15-minute setup and alert recipe I use to make this stack work in the real world? That’s what I’m sharing next—ready to build it step-by-step?
My verdict and a quick-start plan
Santiment’s Medium isn’t fluff. It’s thoughtful a practical field manual that teaches you how to turn on-chain, social, and funding data into clear actions. If you focus on a tight set of metrics and copy their workflows inside Sanbase, you can reduce noise, avoid obvious traps, and time entries and exits with more confidence.
What wins me over is the repeatability. Their posts often show the same patterns playing out across assets and cycles—things like:
- Axie SLP inflation: Rewards outpaced sinks; token price collapsed as supply ballooned—classic incentive mismatch.
- Exchange inflow spikes: Abnormal inflows to centralized exchanges tend to foreshadow sell pressure. I’ve seen this save traders from “looks strong” traps more than once.
- Weighted sentiment: Big spikes in attention and euphoric wording frequently precede local tops, while heavy fear/apathetic lulls show up near bottoms. Independent research has also tied attention/sentiment surges to future volatility in crypto and other markets.
My rule of thumb: act when two signals agree, protect capital when they don’t. One green light is interesting; two is actionable.
Who should jump in
- Active traders: You’ll get earlier warnings and fewer fake-outs by pairing price structure with MVRV, exchange flows, and social spikes.
- Researchers and analysts: You’ll love the context. Their posts link patterns to historical baselines so you’re not guessing in the dark.
- Investors: Use dev activity and long-horizon MVRV to build conviction and avoid buying into euphoric blow-offs.
- Beginners: Totally fine to start free. Keep it simple: one asset, three metrics, weekly notes.
15-minute setup I recommend
If you want a fast, repeatable workflow, here’s the exact play I use:
- Pick one asset: BTC or ETH is easiest to learn on. Open it in Sanbase.
- Mirror a fresh Medium case study: Grab a recent post on Santiment’s Medium, note the metrics they used, and rebuild their same chart stack:
- Price + 30d MVRV
- Exchange inflows (centralized exchanges)
- Social volume + weighted sentiment
- Set three alerts:
- Exchange inflow anomaly: Alert when inflows jump >2 standard deviations above 30-day baseline.
- MVRV bands: Alert when 30d MVRV crosses above +15% (risk) or below −10% (opportunity).
- Social spike: Alert when social volume Z-score > +2 or when MVRV hits an extreme (euphoria or fear).
- Use a simple action matrix:
- Two bearish signals (e.g., MVRV hot + exchange inflow spike) with weak price structure: consider trimming or hedging.
- Two bullish signals (e.g., depressed 30D MVRV + fear-laced social spike) with higher-timeframe support: consider scaling in.
- Mixed signals: Reduce size or wait. No forced trades.
- Journal in 90 seconds:
- Setup: Which metrics fired?
- Context: Any narrative shift noted on Medium?
- Plan: Entry, invalidation, take-profit zones.
- Outcome: Screenshot + brief recap after the move.
Do this once a week for a month. You’ll quickly see which signals fit your style and which ones you can ignore.
Conclusion and next steps
On-chain and sentiment chatter can feel overwhelming. This is the first stack that consistently turns that noise into something you can actually act on. If you keep your focus tight—one asset, a few metrics, clear alerts—you’ll get cleaner reads and better timing.
Next steps:
- Bookmark Santiment’s Medium and pick a post to clone today.
- Set the three alerts above and let the signals come to you.
- Run the weekly journal for 30 days. If it improves your entries even slightly, it pays for itself.
- Keep an eye on CryptoLinks News for new playbooks, tool updates, and comparisons that keep your stack sharp.
Simple rules, consistent signals, and fewer guesses. That’s the edge.