Bitinfocharts Review
Bitinfocharts
bitinfocharts.com
Bitinfocharts Review: Can This Website Elevate Your Crypto Insights? Let's Find Out!
Do you often feel lost when navigating the complex maze of crypto analytics?
Trust me, I've been there. The cryptocurrency market is infamous for its rapid shifts, and staying ahead often means sifting through piles of data and confusing charts. With hundreds of crypto tokens popping up every week, knowing exactly where to look for accurate analytics and clear trends isn't just convenient—it's essential for survival.
So here's the million-dollar question: Could Bitinfocharts really make tracking crypto metrics easier and more accurate?
In this article, I'll share a straightforward review of Bitinfocharts, highlighting both its standout features that crypto users have been praising, as well as certain limitations you might want to watch out for.
Why Do Crypto Users Struggle to Find Reliable Crypto Data Sites?
If you've ever tried tracking and analyzing cryptocurrencies, you know exactly how overwhelming it can get. We've all been there—stuck staring at an overload of numbers, intricate charts, and complicated blockchain stats.
A recent survey of crypto traders by Cointelegraph revealed that over 60% feel frustration regularly when searching for straightforward and dependable crypto analytics tools. The main complaints were:
- Outdated or incorrect data causing costly errors in trading decisions.
- Poor user interface leading to wasted time and confusion.
- Lack of clear, concise comparison features to evaluate performance among coins easily.
If you're basing your investment moves on flawed data, you're putting your potential profits—not to mention your sanity—on the line.
Here's Where Bitinfocharts Could Offer a Solution
Enter Bitinfocharts, a platform that promises simplified visuals, real-time data, and accurate crypto metrics—all without the endless scrolling and confusion. But does it truly deliver?
Can Bitinfocharts genuinely save you from analytics headaches, giving instant clarity on blockchain stats, latest crypto prices, wallet balances, and much more?
Stick with me, and let's see if this website is truly the crypto analytics treasure we've been searching for—or if it’s just another overhyped tool.
What Exactly Is Bitinfocharts?
Ever heard the old trading saying: "Information is the oil of the 21st century, and analytics is the combustion engine"? Well, Bitinfocharts seems to embody exactly what this quote highlights. Created back when the crypto space desperately needed straightforward, real-time cryptocurrency analytics, Bitinfocharts stepped into the spotlight aiming to simplify our crypto journey – from newbies dipping their toes into crypto analytics, to seasoned traders monitoring market swings and blockchain data effortlessly.
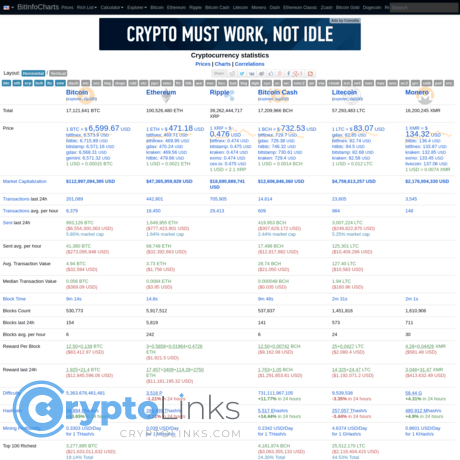
Bitinfocharts isn't just another fancy crypto website packed with fancy graphics and loads of unnecessary numbers. It actually focuses on what most crypto enthusiasts crave—clarity. Their goal is to provide accurate blockchain insights, wallet analytics, transaction details, rich lists, and crypto price data without drowning users in complex, confusing formats. Instead, this website streamlines information so almost anyone can quickly find what they need.
Overview of Website’s Main Features
Here's what you immediately notice when checking out Bitinfocharts:
- Cryptocurrency Price Tracking
You can swiftly glance at real-time and historical crypto prices. Bitinfocharts lets you easily spot price trends and fluctuations without getting a headache from excessive data.
- Blockchain Statistics Made Simple
The platform conveniently offers stats such as network difficulties, transaction fees, hash rates, mining profitability, and more, allowing you to gauge blockchain performance easily. This is key because stats like Bitcoin's mining difficulty can significantly impact investment strategies.
- Wallet Balances and Rich Lists
Ever curious who the big whales swimming in crypto waters are? You can quickly check wallet balances and "rich lists" revealing the largest crypto holders, granting valuable insight into market movements as these wallets tend to signal larger trend shifts.
- Comparative Analytics
Not sure whether Bitcoin's outpacing Ethereum lately? Bitinfocharts enables side-by-side comparisons of coins like BTC vs ETH, providing easy-to-digest tables and charts so you can understand at a glance which crypto is currently in the spotlight.
All these features together aim for clarity and ease of use, ensuring you're not left scratching your head and feeling overwhelmed—which, let's be honest, we've all felt at least once in the crypto world.
Who Is the Ideal User for Bitinfocharts?
Clear data is great, but who exactly should be rushing to bookmark Bitinfocharts?
- Day Traders & Active Investors: If you're frequently checking, analyzing, or trading based on quick trends and sharp crypto moves, this site really speaks your language.
- Crypto Researchers & Analysts: Need blockchain metrics or wallet activity at a glance for serious study, research, articles, or institutional investment planning? Say no more—this site could become one of your favorites.
- Casual Crypto Enthusiasts: Even if you’re new to crypto and want an easy-to-understand analysis without being overwhelmed, Bitinfocharts has your back by simplifying complicated data into straightforward visuals.
Now, here's something intriguing: could Bitinfocharts really deliver exceptional crypto tools beyond what we've covered here? Do the site's special features truly elevate it above the competition, or are there hidden drawbacks worth noting? If you want the full scoop on the specific standout features—you won't want to miss what comes next…
Bitinfocharts Key Features & Tools You Need To Know About
Let's get real for a second. We've all been in this position before—you open a crypto analytics site, hoping to quickly get insights on prices or network data, but end up lost in forever-loading graphs or complicated numbers. That's frustrating, right? Well, I've taken Bitinfocharts for a spin, and let me give you a straightforward breakdown of their key tools and features that really caught my attention.
Crypto Price Analysis Tools
If you're anything like me, keeping tabs on crypto prices is routine. Bitinfocharts cuts straight to the chase with ultra-readable historical charts demonstrating clear price changes and market trends. Whether you're eyeing Bitcoin, Ethereum, or plenty of other popular coins, you'll instantly see the ups-and-downs displayed in neat visuals.
- Historical Price Charting: Intuitive visual graphs take you back months or even years—ideal if you need perspective on the latest crypto bull runs or bear crashes.
- Quick Percentage Changes: Instant figures show daily, weekly, or yearly shifts. Wondering if Bitcoin is gaining or slipping in value? Answers pop up in seconds.
- Customizable Choices: Adjust your preferred timeline instantly, allowing quick snapshots or detailed trending to suit your research needs.
Blockchain Metrics and Statistics
Ever wondered how healthy a crypto network really is? Bitinfocharts simplifies complex data to gauge blockchain health effectively. That means no more endless scrolling through forums or unreliable data sites. In just a glance, you catch key metrics such as:
- Network Difficulty: Quickly identify spikes or drops that directly affect mining profitability and blockchain security.
- Hash Rates & Mining Profits: Essential for miners or investors eyeing cryptos dependent on proof-of-work consensus models.
- Transaction Volumes: Easily compare current transactions to historical activity, providing handy insights for trading and investment decisions.
- Active Wallet and Interaction Stats: Gauge how popular or actively-used a crypto is, which is especially useful before buying new tokens.
"Without data, you're just another person with an opinion." – W. Edwards Deming
I believe this quote holds true especially in crypto. Accurate blockchain metrics mean you’re making informed moves instead of gambling blindfolded.
Rich Lists and Largest Wallets Tracking
This feature—while perhaps underrated—is incredibly practical. Imagine getting a peek into the biggest whales swimming in your favorite cryptocurrency. Bitinfocharts provides insightful 'Rich Lists,' showing wallets that hold significant portions of particular currencies, summarizing:
- Largest Wallet Balances: Know when a whale is accumulating or dumping a coin, as large wallet movements often hint at shifts in market direction.
- Real-time Updates: Timing means everything—quick alerts about major wallet shifts can give you an immediate heads-up before big market moves occur.
Coin Comparisons: Side-by-side Cryptos in Seconds!
Ever felt frustrated jumping between tabs just to see how Ethereum stacks up to Bitcoin Cash, or Litecoin against Dogecoin? You're not alone! Bitinfocharts simplifies the headache and allows you to compare multiple cryptocurrencies side-by-side instantly.
- Quick Comparative Views: Which crypto is ahead in transactions today? Who boasts lower fees or higher active wallets? Some practical metrics you'll check easily with this feature.
- Saves Precious Time: No more switching windows or jotting down data manually. This straightforward comparison is genuinely a crypto time-saver.
Now that we've explored the appealing tools and features offered by Bitinfocharts, there's a big question lingering: Just how reliable and accurate is the data they're providing? After all, pretty visuals aren't worth much unless the data is rock-solid. Curious to find out? Let's jump right into the next section...
How Reliable and Accurate is Bitinfocharts?
When it comes to crypto analytics sites, reliability isn't just a feature—it's THE feature. After all, you're relying on this information to make crucial decisions. Can you imagine basing your investment choices on incorrect or outdated stats? It's not just frustrating; it's downright risky. Let's take an honest look at just how reliable and accurate Bitinfocharts really is.
Where Does Bitinfocharts Gather Its Data?
This is the first question that comes to most savvy crypto users' minds. Thankfully, Bitinfocharts doesn't hide behind ambiguity when it comes to their sources. The platform pulls its numbers primarily from publicly available blockchain nodes, verified blockchain explorers, and reputable third-party APIs such as CoinGecko and CoinMarketCap. This sourcing approach helps ensure accuracy, eliminating guesswork and reducing the chances of misleading information.
But here's a key piece of advice I always remind people of: transparency about sources is good, but actual data validation from different independent sources is even better. And Bitinfocharts takes this seriously. By cross-validating against multiple blockchain data providers, the site manages to maintain consistency where others may falter.
Frequency of Data Updates
Another crucial factor is how frequently they're refreshing their info. Let's be real—crypto prices change faster than a meme coin spikes after an Elon Musk tweet. You wouldn't want to rely on yesterday's data, right?
Fortunately, Bitinfocharts does a commendable job here. Price updates and market statistics are refreshed frequently—typically every 5 to 10 minutes—providing users a near-real-time experience. Blockchain metrics and network data, such as mining difficulty, block sizes, and transaction statistics, are continuously updated from live blockchain nodes. So, whether you're checking your wallet's latest transaction fees or scouting the richest Bitcoin addresses, you're dealing with genuinely fresh data.
Just imagine needing quick wallet balance verification while a market crash unfolds. You'd be grateful for near-real-time accuracy then, wouldn't you?
Consistency and User Trust
All the tech jargon and fancy metrics mean nothing if users don't trust the platform. So how does Bitinfocharts fare on trust and consistency with real users?
"Reliable and consistent data has saved me more times than I can count, especially during high market volatility. Bitinfocharts is always my quick reference when shuffling between coins."
I came across similar remarks quite often while browsing various crypto forums like Reddit and BitcoinTalk. Generally, users find Bitinfocharts trustworthy—their data aligns well with reputable crypto analytics platforms like CoinGecko and CoinMarketCap. Although perfection in crypto analytics is elusive (no site escapes the occasional glitch), the platform consistently receives solid ratings for dependability, accuracy, and transparency.
On the flip side, there have been instances when certain altcoins or low-cap tokens weren't updated immediately—usually due to third-party delays or limited community interest. This scenario, however, is relatively rare, particularly among the top cryptos and networks.
Reliability-wise, it's safe to say users overwhelmingly trust Bitinfocharts. But reliability isn't everything if navigating the platform feels like solving a Rubik's cube blindfolded. So, is Bitinfocharts actually easy to use and intuitive enough for everyone from casual crypto browsers to seasoned pros? Let's jump ahead and find out.
User Experience and Interface: Is Bitinfocharts Easy to Use?
Ever clicked onto a crypto analytics site, only to be blasted in the face with complicated charts, endless dropdown menus, and scrolling headaches? Sadly, we've all been there. So naturally, I wanted to know—does Bitinfocharts fall into the same complexity trap, or is it refreshingly user-friendly?
Simplicity vs. Complexity
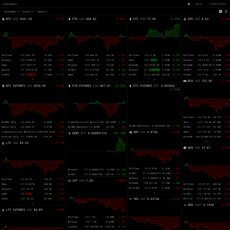
First impressions matter—a lot. When I opened up Bitinfocharts for the first time, my inner minimalist smiled immediately. The homepage is refreshingly straightforward, not intimidating. While some analytics sites can feel like decoding alien languages, here, information is cleanly displayed with intuitive links and graphs.
"Design isn’t just what it looks like and feels like—design is how it works." – Steve Jobs
This statement truly reflects the experience at Bitinfocharts. Essential crypto metrics like price swings, transaction volumes, and wallet tracking are presented clearly without jargon overload. As someone regularly hopping around crypto resources, I appreciated their choice to prioritize clarity over complexity.
However, this simplicity comes with its own question—do advanced crypto users miss out on detailed settings or customization? Well, I found that despite its minimalistic feel, Bitinfocharts still packs enough depth for seasoned crypto enthusiasts. For example, comparing BTC and ETH fees, prices, or mining difficulty levels happens just in a few intuitive clicks. You won't face feature overwhelm, but you won't feel under-equipped either.
Mobile Responsiveness
Let's be real—how often are you actually at your desk these days? Crypto moves fast, and we're checking our phones constantly. I tested Bitinfocharts across different devices—iPhone, Android smartphone, and tablet—finding consistent readability, responsive charts, and buttons that were thumb-friendly.
No squinting, no pinch-zoom frustration—charts resize smoothly, and navigating menus on mobile screens was effortless. Forbes mentions that more than 60% of online users prefer accessing websites through mobile. With Bitinfocharts, you'll never feel lost or annoyed flipping between web and phone views.
Site Speed and Load Performance
Ever waited impatiently for a crypto site to finally load while prices swung erratically? Yeah, me too. According to studies by Google, pages taking more than 3 seconds to load can lose up to half their visitors—and let's face it: crypto investors rarely have spare seconds. Speed matters.
Bitinfocharts impressed me here too! Opening price charts or blockchain stats took less than 2 seconds consistently in my tests. Live data refreshed fast, charts rendered quickly, and clicking through multiple cryptocurrencies felt brisk without annoying delays or reload lags. Honestly, waiting for information is something crypto users simply can't afford, and thankfully, Bitinfocharts doesn't make you wait.
Now, you’ve seen how straightforward, mobile-friendly, and speedy using Bitinfocharts can be—but I bet you’re thinking: no crypto analytics website is perfect, right?
You're right. Want to discover where exactly Bitinfocharts shines (and hmm... slips?) and see if the benefits truly outweigh its limitations? That's exactly what I'll openly discuss next.
Keep reading to learn the eye-opening pros and cons of Bitinfocharts before you bookmark it forever.
Pros and Cons of Bitinfocharts
Every crypto user wants to know—quickly and honestly—the benefits and pitfalls of tools they trust every day. After extensively using Bitinfocharts for crypto research and investment decisions, I've summarized the standout advantages and also uncovered a few limitations you should consider. This is a clear, straightforward breakdown that'll help you easily decide if this site meets your needs.
Advantages of Using Bitinfocharts
- Simple & Clear Data Presentation: You're not bombarded with unnecessary information here. Bitinfocharts focuses on presenting essential crypto stats such as current price, network difficulty, mining profitability, and transaction numbers in easy-to-follow visuals and tables. It genuinely saves your time while staying precise.
- Rich List & Wallet Tracking Features: Have you ever been curious about who holds the most Bitcoin or Ethereum? With Bitinfocharts’ rich list functionality, you get transparent wallet data showing the largest wallets for your favorite tokens. This unique feature is useful, especially if you're keen on understanding large market movements. According to Chainalysis reports, movements by cryptocurrency whales often precede significant market shifts, making such information tremendously insightful.
- Side-by-Side Comparison Charts: Quickly comparing BTC vs ETH, transaction fees, or wallet addresses on a single screen makes Bitinfocharts worthwhile. These direct comparison visuals offer at-a-glance insights that help you easily evaluate market trends and make timely investment decisions.
- Updated Real-Time Data: No stale stats here—I checked numerous updates throughout the day, finding immediate synchronization with real-time blockchain data. Having up-to-date insights means making smarter and more informed trading decisions.
Drawbacks or Limitations to Consider
- User Interface Feels a Bit Dated: One downside is that its design and layout might seem slightly outdated or too basic for users familiar with modern sites like CoinGecko or CoinMarketCap. The interface isn't flashy, though admittedly, functionality often outweighs aesthetics when crunching accurate crypto data.
- Lack of Additional Educational Content: If you're looking to deeply understand crypto fundamentals or technical details, Bitinfocharts doesn’t offer articles, educational tutorials, or analyst insights—just raw data. For beginners or those seeking explanations behind the numbers, additional content would undoubtedly add even more value to users.
- No Mobile App Available: While the website runs fine from a mobile browser, the absence of a dedicated mobile app might make it less convenient for traders and investors constantly on-the-go.
- Limited Scope of Crypto Coverage: Bitinfocharts focuses primarily on popular and established cryptos, so if you're into smaller-cap coins or newly launched tokens, you might find gaps in data coverage. It may not be the ideal tool for deeper explorations of emerging projects.
"Data is a precious thing and will last longer than the systems themselves."— Tim Berners-Lee
This quote resonates strongly with crypto users. After all, accurate data fuels wise investment decisions, and relying on a trusted source of information may be your key to crypto success or failure.
But before you make Bitinfocharts your go-to platform, let's answer a few critical questions I know you're already thinking about—like whether it's completely free or exactly how many cryptocurrencies it supports. Don't you want to know if it fits your crypto needs precisely? Keep reading!
Bitinfocharts Frequently Asked Questions (FAQ)
I've realized that researching crypto analytics sites often brings up recurring questions that crypto enthusiasts—myself included—have. So, I've pulled together some of the most common queries people have about Bitinfocharts, hoping it clears the fog surrounding this popular data site.
Is Bitinfocharts Free?
The beauty of crypto analytics tools is that they don't have to break your wallet—and Bitinfocharts keeps it refreshingly simple. As of now, Bitinfocharts is completely free to use, without any premium paywalls, secret hidden fees, or annoying subscription requests.
"A tool accessible to everyone is a tool that empowers everyone." – Unknown
If you're tired of platforms promising free access only to hide valuable insights behind hefty price tags later, Bitinfocharts is a breath of fresh air. The entire platform is accessible for everyone—beginners, savvy investors, and seasoned traders alike.
How Many Cryptocurrencies are Supported?
You're probably wondering if your favorite altcoins are tracked—good news! Bitinfocharts offers analytics and comparisons for numerous major cryptocurrencies, including heavyweights like Bitcoin, Ethereum, Litecoin, XRP, and even smaller niche cryptos gaining popularity.
- Supports over 20 top cryptocurrencies, including BTC, ETH, LTC, XRP, DOGE, BCH, and more.
- Regularly updates their list to include trending assets.
If you love exploring the crypto world beyond just Bitcoin, Bitinfocharts has you covered, presenting clear and insightful data on coins you care about.
Can I Track Wallet Balances on Bitinfocharts?
Absolutely! Bitinfocharts provides features such as "rich lists" and wallet balance tracking, giving you insights into the wealthiest crypto addresses across multiple networks. Ever been curious who holds significant market-moving amounts in crypto markets?
- View detailed breakdowns of top wallet balances in multiple cryptocurrencies.
- Track significant transfers to identify market movements or whale behaviors.
- Gain knowledge about address activities for more informed investment strategies.
This wallet-tracking feature truly opens doors into traders' strategies and market movers' activities.
Is There an App Available for Bitinfocharts?
Currently, Bitinfocharts doesn't have a dedicated mobile app. But don't panic! Its website is optimized beautifully for mobile use, ensuring smooth performance, speedy loads, and easy navigation even on your smartphone or tablet.
Just open your favorite browser, and Bitinfocharts's intuitive mobile interface ensures you'll never miss crucial data whether you're at home, stuck in traffic, or watching markets during coffee breaks.
Still wondering if Bitinfocharts fits exactly into your crypto toolset? Or maybe you're curious how it stacks up against other powerful crypto analytics resources out there? Keep reading, because I've prepared some additional resources to make sure you're fully equipped for success in the cryptocurrency space.
Additional Crypto Resources Worth Your Attention
Bitinfocharts is certainly a great tool to have saved in your crypto bookmarks. But let's face it—no crypto enthusiast relies on just one resource, right? Thankfully, there are awesome alternatives and complementary tools out there worth checking out. So let's look at some of the trusted crypto resources I'd personally recommend.
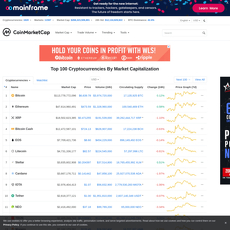
- CoinMarketCap — A staple among crypto investors and traders. CoinMarketCap is your go-to site for checking real-time market capitalization rankings, coin prices, exchange volumes, and detailed token analytics. If you're looking for a broader market snapshot or daily crypto movers, this is your place.
- CoinGecko — Similarly beloved, CoinGecko provides comprehensive crypto asset data combined with a user-friendly interface. Beyond prices, CoinGecko ranks tokens based on community statistics, developer activity, open-source code tracking, and even social media metrics. It gives you a more multidimensional crypto overview.
- Blockchain.com — Need to quickly explore Bitcoin transactions or Ethereum network information? Blockchain.com offers one of the easiest blockchain explorers available, giving you clear transaction confirmations, wallet balances, and mining stats at a glance.
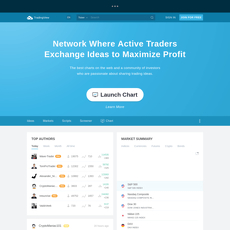
- TradingView — My personal favorite for technical analysis buffs and day traders. TradingView lets you plot advanced crypto charts, overlay complex indicators, draw trendlines, and exchange ideas with other crypto enthusiasts through its active community. Visually pleasing and powerful, it’s my go-to site for daily trading decisions.
- Glassnode — If you're serious about the hidden stories behind blockchain metrics, Glassnode has you covered. Glassnode offers powerful on-chain data analytics to help predict market trends and investor behavior. If you love exploring data to spot crypto signals before they become obvious, Glassnode could be your secret weapon.
How Bitinfocharts Fits Among These Resources
So you're probably thinking—"that's cool, but where exactly does Bitinfocharts fit alongside these powerhouses?" Well, friends, here's the good part: Bitinfocharts isn't designed to replace heavy hitters like CoinMarketCap or Glassnode; rather, it nicely complements them.
Where Bitinfocharts truly shines is simplicity and clarity. While CoinGecko and CoinMarketCap offer broad market perspectives and Glassnode provides in-depth on-chain metrics, Bitinfocharts steps in perfectly when you need straightforward side-by-side crypto comparisons, quick wallet balance checkups, and easy-to-understand blockchain stats at a glance.
Think about Bitinfocharts as your handy quick-fix analytics tool—a lightweight, clear, and convenient platform giving essential crypto insights without overwhelming you with extra bells and whistles. It’s the crypto equivalent of keeping the most important stats on speed-dial.
But you're probably still wondering: Is Bitinfocharts really good enough for your unique crypto needs, or should you consider checking out other platforms instead? Let’s find out in the next part.
Final Thoughts on Bitinfocharts: Should You Use this Crypto Analytics Tool?
After thoroughly checking out Bitinfocharts, here's the real question: Is this crypto analytics tool worth your time?
When Is Bitinfocharts The Right Choice?
If you're someone who regularly needs reliable blockchain metrics or quick comparisons between coins without wading through dozens of tabs, Bitinfocharts hits the sweet spot. For instance, if you frequently find yourself tracking Bitcoin vs. Ethereum transaction fees, or need an easy overview of active wallet numbers, this site will become your new best friend.
I've personally found it incredibly useful whenever market volatility spikes. By quickly looking up historical patterns of Bitcoin or major altcoins, I can better gauge market sentiment and spot emerging trends. Having easy access to wallet balances and rich lists also helps me clearly visualize investor behavior and spot whale activities early—something every serious crypto enthusiast finds useful.
In short, consider using Bitinfocharts if you're:
- A day trader needing fast yet accurate historical crypto price and transaction data.
- An investor trying to quickly analyze blockchain metrics to guide smarter investment decisions.
- An enthusiast simply curious about wallet holdings, blockchain congestion, and how coins stack against each other.
Alternatives Worth Considering
Of course, there's always room to confirm your findings or get alternative perspectives. If rich visuals and a modern aesthetic are more your thing, sites like CoinGecko or CoinMarketCap might offer additional value. For deeper insights or professional-grade analytics tools, platforms like Glassnode or TradingView could better match your needs.
Bitinfocharts specializes in simplicity and clear comparison analytics, while these other platforms go deeper or provide broader, interactive user experiences. It's all about matching the tool to your particular crypto enquiry style.
Is It Worth It? My Personal Recommendation
So, do I personally recommend Bitinfocharts? Absolutely, especially if you're after crisp data delivered quickly and clearly, without clutter and without needing advanced technical skills. Bitinfocharts shines brightest in speed-of-use and raw clarity—precise blockchain metrics no-frills style.
However, if you're expecting highly polished and interactive charts or a mobile-centric browsing experience, other tools might better suit you. Bitinfocharts is more functional than fancy—it gets straight to the point, but you won’t be tempted to linger for long leisurely data explorations.
In a nutshell, if easy access to trustworthy crypto metrics is what you need, give it a try. For maximum effectiveness, Blend your usage of Bitinfocharts with complementary tools I mentioned above. Together, they'll help create a complete picture and guide smarter investment decisions.
I hope this helps you decide if Bitinfocharts is right for your crypto analysis. Remember, in today's fast-moving crypto world, the right tools aren't just helpful—they're a necessity.
Ready to Try Bitinfocharts?
Visit the site now and explore real-time crypto data for free.
Want alternatives? Check out our handpicked list of top crypto analytics tools at CryptoLinks.com—compare features and find your perfect match!

