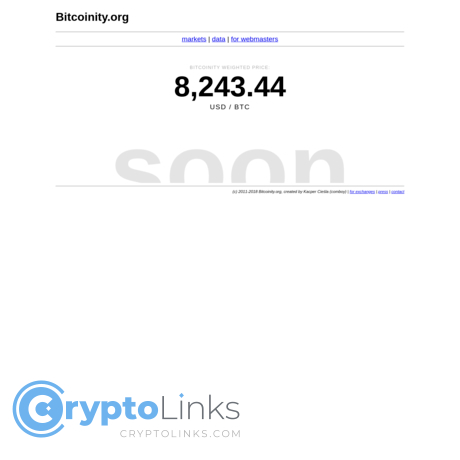
bitcoinity.org Review
bitcoinity.org
bitcoinity.org
Bitcoinity.org Review Guide: Everything You Need to Know About It + FAQ
Ever wished you could see Bitcoin’s true heartbeat without opening five tabs and waiting for bloated charts to load?
Looking for a fast, no-nonsense way to watch Bitcoin markets in real time? I’ve used Bitcoinity.org for years, and in this guide I’ll show you how to get the most out of it without wasting time.
The big win: you get a live view of price, volume, market share, and order books across top exchanges in one place—free, no signup, and quick to load.
When volatility spikes, seconds matter. A clean, fast feed can be the difference between reacting and overreacting.
Why most Bitcoin dashboards slow you down
Let’s be honest: a lot of market sites are built to impress, not to help you act. That creates a few common headaches:
- Cluttered UIs and laggy charts: Fancy overlays and heavy scripts slow things down when you need speed the most.
- Fragmented views: You check price on one site, order books on another, and volume somewhere else—losing the real story in the shuffle.
- Paywalls and logins: Basic data gets gated or delayed, so you’re always a step behind unless you subscribe.
- One-exchange blind spots: Relying on a single venue can mislead you. Different exchanges have different liquidity and behavior. Industry work has shown how uneven venues can be—see the 2019 Bitwise analysis to the SEC on reported vs. real volume for context.
Here’s a real-world example: a sudden red candle on one exchange often looks dramatic. But if other major venues aren’t showing matching volume or order book pressure, that move can fizzle fast. Without a unified, real-time view, it’s easy to overreact to noise.
What I’ll help you do in minutes
I’ll show you how Bitcoinity pulls real-time data from multiple exchanges, how to read its heatmap-style order book, and how to set up a clean workflow for quick decisions—whether you trade or just track the market.
- See live trades across venues to confirm if a move is broad or isolated.
- Spot liquidity walls that can act like magnets—or traps—around key levels.
- Check market share so you know where the action actually is right now.
- Keep it fast and simple, no logins, no bloat.
What you’ll get from this guide
Short, practical sections—no fluff. By the end, you’ll know:
- How Bitcoinity works and what makes it reliable for live reads.
- The features that matter (and what to ignore) to save time.
- Simple daily setups for desktop and quick mobile checks.
- Accuracy tips and how to spot exchange hiccups before they fool you.
- Straight answers in a FAQ for the questions people actually ask.
Ready to keep it simple and fast? Great—next up, what exactly is Bitcoinity.org and who gets the most value from it?
What is Bitcoinity.org and who is it for?
Bitcoinity.org is a lightweight, real-time Bitcoin market tracker that streams price, trades, and order book data from multiple exchanges in one fast window. No logins, no fluff—just the heartbeat of BTC across venues, the way a market tool should feel.
"In fast markets, clarity is an edge."
Quick purpose and history
I first bookmarked Bitcoinity back when most crypto dashboards were heavy, slow, or ad-choked. Bitcoinity took a different path and never lost the plot: show live data you can trust, make it load instantly, and let people compare exchanges without clicking through five menus.
That design choice still pays. During high-volatility events (think CPI prints or sudden ETF headlines), I can open a single tab, watch BTC/USD across top venues, and know where the real liquidity sits right now. Market microstructure research has long shown that visible liquidity and order book imbalance can hint at short-term direction (multiple studies across equities and FX echo this), so seeing clean order flow in real time isn’t just “nice”—it’s practical signal.
Who will love it
- Intraday traders: If you watch order flow and pace, a clean tape and depth read are gold. Example: when a 500+ BTC ask wall keeps stepping down on two exchanges, I expect price to “test” that liquidity.
- Long-term holders: You don’t need indicators. A 20-second peek shows spreads, liquidity health, and whether today’s move is broad-based or just one venue acting weird.
- Analysts and journalists: Quick cross-exchange context during breaking news—no screenshots from five platforms.
- Builders and product folks: Sanity-check market share by venue and track how liquidity migrates during regime shifts.
Real example from my screen last quarter: on a sharp move after a policy headline, Coinbase and Bitstamp showed tight spreads and synchronized bursts, while one offshore venue lagged by seconds with chunky walls that vanished on touch. That mismatch told me where the “truthy” price discovery was happening—useful in the heat of the moment.
What you can and can’t do
- What you can do:
- Watch live trades and a tape that actually moves with the market.
- Read order book depth and spot outsized bids/asks that act like magnets—or traps.
- Compare exchanges and see real-time market share to know where volume truly lives.
- Toggle time ranges for quick context without loading a heavy charting stack.
- Focus on major BTC pairs (e.g., BTC/USD, BTC/EUR) for the cleanest liquidity picture.
- What you can’t do:
- Place trades or connect your exchange accounts—this is a read-only window.
- Run advanced indicators, custom scripts, or deep technical studies.
- Export tick-level historical datasets from the site itself.
- Turn it into an altcoin screener; it’s intentionally focused on Bitcoin.
I like that it doesn’t try to be everything. Simplicity keeps it fast, and speed keeps it useful. As the saying goes in markets, “time is alpha.”
Curious which specific features actually save time and help you read intent—like the heatmap that makes big walls impossible to miss? Want a quick setup you can copy in under a minute? Let’s look at the ones worth your attention next.
Key features worth your time
When I open Bitcoinity, I’m not looking for fireworks—I’m looking for signal. These are the features that actually help me read the market fast and act with clarity.
Live price and trades feed
This is your tape. Trades print in real time across the exchanges you select, and the change in pace is often the earliest tell that something is shifting.
- Rhythm check: A calm market might tick along at a few trades per second. When a macro headline hits, I’ve watched it jump to dozens per second, spreads widen, and prints chase each other up or down.
- Size clustering: A cluster of similar-sized prints (say, 5–10 BTC repeatedly) often signals an algo working an order. If the flow is one-sided and sustained, I pay attention.
- Cross-venue confirmation: If multiple exchanges light up together, it’s usually a real move. One exchange alone? That’s a yellow flag.
Why it matters: market microstructure research has long shown that order flow and trade intensity carry information about short-term price changes. If you like to geek out, this idea is formalized in work like Cont, Kukanov, and Stoikov (2014) and related studies on order flow imbalance.
“Markets shout before they move. The tape is where you hear it.”
Order book depth and heatmap
The heatmap is where Bitcoinity quietly shines. You see bids and asks stack up, thin out, and get pulled—without wading through clutter. Big resting orders often act like magnets; sometimes they’re traps.
- Liquidity magnets: A 1,000 BTC bid sitting ~1% below price tends to attract a retest. If that wall sticks and gets partially filled then replenished, it’s real interest.
- Spoofing tells: If a giant wall keeps jumping closer to price and disappears just as price tags it, that’s classic spoof-like behavior. Treat it as a wind change, not a floor.
- Replenishment (“icebergs”): When a level refills immediately after partial fills, someone is defending it. I watch the intensity of replenishment vs. the speed of aggressive hits.
- Distance to mid: Walls that move in sync with price—always just out of reach—often signal intent to influence, not to trade.
There’s academic backing to the idea that order book events—adds, cancels, and trades—impact short-term price discovery. See the earlier order book events research and broader work on liquidity and high-frequency trading behavior. The takeaway: watching the book in a heatmap view cuts through noise and surfaces intent.
Exchange selector and market share
Not all venues are equal. Bitcoinity lets you toggle exchanges and see where the real action is right now, which matters because liquidity quality shapes how price moves.
- Session behavior: During U.S. hours, I often see tighter spreads and deeper books on Coinbase/Bitstamp/Kraken for fiat pairs; during Asia hours, different venues may lead the flow.
- Market share in context: Use it as a sanity check—if most volume is pushing through one venue, you’ll feel its microstructure in the tape.
- Quality over quantity: Multiple analyses (e.g., the Bitwise report to the SEC, 2019 and Forbes 2022) have highlighted inflated volumes on some venues. That’s why I focus on venues with long-standing fiat rails and consistent books when I want clean signals.
Flip exchanges on and off in seconds. If removing one venue makes the picture calmer and more believable, keep it off. Simple.
Time ranges and simple overlays
Bitcoinity stays lean, which is its edge. I use quick time switches to go from “what just happened” to “how the session is shaping up.”
- Short bursts (1–5m): Perfect for news shocks and seeing if volume sticks or fades.
- Session view (1–4h): Helps spot whether repeated walls or flows are part of a larger theme or just noise.
- Keep overlays light: It’s not a TA playground—good. You get speed and fewer false anchors.
Supported pairs and currencies
The focus is Bitcoin, which keeps things quick. Choose the pairs that matter for liquidity and price leadership:
- BTC/USD and BTC/EUR: My go-to for fiat price discovery across Coinbase, Bitstamp, and Kraken.
- BTC/USDT: Useful to sense stablecoin-driven flows, especially on venues like Binance.
- Regional flavors: If you care about basis or regional liquidity, peek at JPY or GBP pairs during local hours.
One strong pair beats six weak ones. Pick the pairs that actually move your market.
Small touches that help
There’s a reason I can leave Bitcoinity open all day without my laptop sounding like a jet.
- Fast, minimal UI: No login, no fluff, no distractions—just the data.
- Quick filters: Add/remove exchanges on the fly, tweak aggregation, and keep only what’s useful.
- Low friction: It loads instantly, which matters when seconds count.
As a practical example: on CPI days, I keep only BTC/USD from a few reliable fiat venues, watch the trades feed for pace/size, and park the heatmap near the last swing levels to see which side caves first. It’s a clear, repeatable read.
Curious how I arrange all this for a clean, daily setup that takes under a minute—what exchanges I pin, how I avoid false walls, and the exact settings I use before news drops? Let’s look at that next.
How I set up Bitcoinity for daily tracking
I use Bitcoinity like a heartbeat monitor: fast, uncluttered, and always open. The goal is a two-second read on price, liquidity, and flow so I can react without second-guessing.
“Amateurs talk price. Pros talk liquidity.”
Clean layout for a quick read
My default screen is boring on purpose—because boring is fast:
- Pick 2–3 top exchangesfor your region and pair (I rotate between Coinbase, Bitstamp, Kraken for BTC/USD).
- Lock the main pair (BTC/USD or BTC/EUR) and avoid switching unless you need to.
- Keep the order book and trades visible at the same time. I want to see the book breathe and the tape confirm it.
- Zoom the depth to a practical window (just a few hundred to a couple thousand dollars on each side). Too wide, and signal gets lost.
Why this works: a clean book + tape setup gives you instant context. Order book imbalance has been shown to predict short-term price pressure, and cancellations can be as informative as trades themselves. If you like the research angle, take a look at “The Price Impact of Order Book Events” (Cont, Kukanov, Stoikov) on arXiv—useful mental models for what you’re seeing live.
Compare liquidity across venues
Bitcoinity makes it painless to check where execution is likely to be smooth vs. choppy. I toggle exchanges on/off and watch three things:
- Spread: Who’s consistently showing the tightest best bid/ask?
- Depth near price: How many BTC sit within a tight band (say, the first $100–$300)? This is your short-hop liquidity.
- Market share right now: If most flow is on one or two venues, they’ll often “pull” price action.
Example: around the U.S. morning session, if Coinbase and Bitstamp show tighter spreads and more size near price than a higher-fee venue, I expect cleaner follow-through there. When liquidity is scattered and shallow, I expect chop and slippage.
Spot big walls and likely traps
Walls are where emotion lives. Big bids and asks create magnets for price—until they don’t. Here’s how I read them:
- Magnet behavior: If a 200+ BTC wall inches closer to price and survives partial hits, it often attracts a test.
- Reloading tells: Watch the wall refill at the same level after trades hit it. That’s a real participant defending.
- Cross-venue alignment: Similar-size clusters appear at nearby levels across multiple exchanges? Stronger signal.
- Spoofing red flags: A huge wall appears, nudges price, then vanishes milliseconds before a touch—treat it as bait.
Order placement and cancellation patterns can move markets even without a trade printing. Academic work in market microstructure consistently shows limit order dynamics shaping short-term returns. The trick is to focus on persistence (keeps showing up) versus theatrics (appears only to scare).
Track volume bursts
When the tape accelerates across multiple venues, I take the move seriously. If it’s isolated to one exchange, I stay cautious.
- Look for synchronized bursts: Trades-per-second and notional value jumping in tandem across exchanges is a strong tell.
- Pair it with the book: If volume surges while nearby liquidity thins, continuation is more likely.
- Use a baseline: Mentally bookmark “quiet” periods for your timezone. A 3–5x jump vs. baseline is meaningful.
Typical scenario: a macro headline hits, you see prints light up on Coinbase, Kraken, and Bitstamp at once, spreads widen a touch, and resting liquidity steps back. That cocktail often signals a genuine move rather than noise. Price co-moves across venues quickly; this “one market” effect is well documented in microstructure studies of informational leadership and common price factors.
Quick mobile check
On the go, I simplify ruthlessly:
- Keep only price and the trades feed visible. Fast, readable, no pinching and zooming.
- Toggle on just one or two reliable exchanges to cut bandwidth and clutter.
- Use it as a pulse check, not a decision terminal. Save the order book study for a desk screen.
I’ll glance during key sessions (New York open, FOMC days, CPI prints) and wait to act until I can read the book properly. It’s amazing how much stress you avoid when the phone view is just signal.
One last thing before we keep going: real-time looks great, but it’s only as good as the feeds behind it. Ever wondered exactly where Bitcoinity pulls data from and how much you can trust the timestamps when things get wild?
Data sources, accuracy, and trust
Where the data comes from
Bitcoinity pulls live feeds straight from exchange APIs. Most major venues stream trades and order-book updates via WebSocket (fast, event-based), while a few still rely on REST polling for certain endpoints (slower, interval-based). That mix explains why one exchange might look snappy while another feels a step behind.
- What can go wrong: exchange-side throttling during volatility, maintenance windows, or network hiccups. When that happens, you’ll see the tape slow down or the book stop moving on that specific venue while others keep flowing.
- What I do: if one feed freezes, I toggle that exchange off, refresh, or check its status page or incident dashboard to confirm it’s not just me.
“Trust the tape, but verify the feed.”
Latency and gaps
“Real-time” is fast, not flawless. Even with WebSockets, you’re still at the mercy of exchange servers, network routes, and your own connection. Normal conditions can look like sub-500 ms updates; stress events can stretch that into multiple seconds for certain venues.
- Telltale signs of staleness: the spread doesn’t change for several seconds while other exchanges are moving, the order book looks frozen, or the last trade timestamp lags behind the current time.
- Quick sanity checks I use:
- Compare two liquid venues (e.g., Coinbase and Kraken). If both print in sync, I trust the move. If only one spikes, I’m cautious.
- Watch the spread. If price “moves” but the spread on that venue doesn’t, you may be seeing delayed updates.
- Refresh or deselect a suspect exchange to remove “noise” from your read.
Real-world note: during high-volatility windows (think news releases or liquidation cascades), exchanges sometimes throttle aggressively. It’s not a Bitcoinity issue—it’s the source. Your job is to spot it and adapt fast.
Privacy and security
Bitcoinity is a read-only market viewer: no accounts, no deposits, no API keys. That alone cuts most of the typical risk. Still, a few basic habits go a long way:
- Use the official domain: bitcoinity.org. Bookmark it to avoid lookalikes.
- Prefer HTTPS when available and avoid logging market sessions on random public Wi‑Fi if you can help it.
- No keys, ever: if any page pretends to “connect your wallet” in Bitcoinity’s name, back out—it’s not legit.
Limits to keep in mind
Think of Bitcoinity as a fast window into the live market—not a full data lab.
- Not for backtesting: you won’t get tick-by-tick historical exports here. For datasets, use exchange APIs or vendors like Kaiko, Coin Metrics, or CryptoCompare.
- Volume quality varies by venue: smaller, offshore exchanges have a history of inflated volume. The 2019 Bitwise submission to the SEC found most reported Bitcoin spot volume was not economically real across many fringe exchanges.
- What I do: focus on reputable, liquid venues and filter out suspect feeds. If a venue looks off (weird spikes, thin book, constant desync), I exclude it from my view.
How I build trust in what I’m seeing
- Cross-venue confirmation: a move that prints on two or three top exchanges with rising volume is usually “real enough” for decisions.
- Spread and depth check: if spreads are widening and depth is thinning across venues, I expect whipsaws and stay nimble.
- Persistence of walls: legitimate liquidity tends to sit and get partially filled; spoof walls pop in/out or chase price. If a wall keeps stepping closer without fills, I treat it as bait.
- Status awareness: keep links to exchange status pages handy. Confirm, adjust, move on.
Bottom line, I want the truth in seconds, not perfection in minutes. And that’s exactly the trade-off here. Curious when this lightweight setup beats heavier tools—and when it doesn’t? That’s next.
Where Bitcoinity shines vs. when you may want something else
When it’s the best pick
When speed and clarity matter, this is the window I keep open. It trims the fat and shows what actually moves price: trades hitting the tape, spreads, and real order book pressure across major venues.
- Breaking news moments: CPI print, ETF headlines, or a big liquidation wave? I’ll flip on top exchanges and watch spreads and book pressure in real time. If Binance and Coinbase both show asks getting eaten and walls walking up, I know the move has legs.
- Quick venue check before placing size: I scan who has the tightest spread and deepest near-touch liquidity. Execution cost is mostly spread + impact; multiple studies and vendor research show that finding depth near best bid/ask reduces slippage. A fast, clean book view saves me from guessing.
- Filtering out noisy venues: Not all volume is equal. The well-known Bitwise analysis to the SEC found a lot of “reported” crypto volume was unreliable, and real activity clusters on a handful of exchanges. Seeing live market share on one screen helps me focus where price discovery actually happens. Bitwise, 2019
- Order flow tells: A heavy bid wall that keeps inching up, or layered asks that vanish when touched—those are meaningful signals. Academic work on limit order books shows that imbalance carries short‑term predictive power. DeepLOB (Zhang et al., 2018)
- Keeping my head straight: When candles go vertical, complex charts can push you into overthinking. A lean flow/heatmap view calms the noise and shows what’s real right now.
“Fast is a feature. Clarity under pressure beats complexity at rest.”
When to reach for other tools
Some jobs need more than a live window. Here’s when I pair or switch:
- In-depth TA and strategy testing: If you rely on multi-timeframe indicators, custom signals, or want to backtest, use a dedicated charting platform or research terminal.
- Price alerts and automation: Bitcoinity won’t ping your phone. For alerts and simple bots, plug in an alerting tool while leaving the live feed open for context.
- On-chain metrics and wallets flows: For exchange inflows/outflows, realized cap, or miner behavior, you’ll want an on-chain analytics provider. That layer answers the why, while the live book shows the now.
- Derivatives and risk: Funding, open interest, basis, and liquidation maps live outside a pure spot feed. A derivatives dashboard fills that gap.
- Historical datasets: Need tick-by-tick history or full-book snapshots for research? Go with an exchange API or a data vendor; this is built for live reading, not warehousing data.
A smart combo approach
I treat it like a heartbeat monitor and layer the rest as needed:
- News/fed days: Keep the live order book and trades on screen. Let your alert tool mark key levels. When an alert fires, glance at the heatmap—are walls absorbing or retreating? That alone filters a lot of fake breakouts.
- Range sessions: Pre-mark your range with your charting tool. Leave the live feed open to watch which side gains inventory. If bids keep stacking near the low, I prepare for a clean mean-reversion entry rather than chasing.
- Weekend liquidity traps: Thin books are easy to spoof. I watch for oversized walls that appear and vanish within seconds. If they’re not getting hit even when price tags them, I avoid getting baited.
Want the quick answers—like “Is it free?” or “Why does one exchange look delayed?” The next section has the no-fluff FAQ that clears those up fast. Ready?
Bitcoinity FAQ: real questions I get a lot
Is Bitcoinity free?
Yes—100% free. No account, no credit card, no email. Just open bitcoinity.org and you’re in.
Is Bitcoinity safe?
It’s a read-only market viewer. You’re not connecting wallets or exchange APIs, so your exposure is low. Just make sure you’re on the official site: http://bitcoinity.org/. Bookmark it to avoid lookalikes.
Reality check: I’ve kept it pinned for years on a “quiet” browser profile—no logins, no extensions. It’s an easy way to keep risk near zero while watching the tape.
Does it support altcoins?
It’s focused on Bitcoin, mainly major fiat pairs. If you live in altcoin land, pair Bitcoinity with a broader screener for alts and keep Bitcoinity as your BTC heat check.
Where do prices come from?
From exchange APIs you pick in the interface. Toggle venues on/off to shape your view. This matters: some exchanges punch above their weight during news events, others go quiet.
Why I’m picky about exchanges: the well-known Bitwise report to the SEC (2019) showed a ton of reported crypto volume was suspicious. On Bitcoinity, I stick to liquid, reputable venues so the feed reflects real trading.
Can I set price alerts?
Not on Bitcoinity itself. I run alerts in a separate app, then keep Bitcoinity open to watch order flow when an alert fires. That combo lets me act with context, not guess off a ping.
Can I download historical data?
No deep history exports here. If you need datasets, grab them from exchange APIs or a data vendor. Use Bitcoinity for the live picture; use dedicated sources for backfills.
Why does one exchange look delayed?
API hiccups and rate limits happen. Signs include stale trades or a flat order book while others move.
- Quick fix: toggle the exchange off and on
- Hard refresh the page
- Cross-check the venue on its native site/app
Tip: If only one exchange spikes while others stay calm, I wait. Real moves usually echo across multiple venues within seconds.
Can I see combined order books?
Bitcoinity lets you view multiple exchanges side by side and read the landscape fast. For a perfectly merged book with advanced filters and per-venue latency controls, you’ll want a specialized terminal or data service.
Practical sample: I watch two or three books in parallel. If a large wall sits at the same level across venues, that level often acts like a magnet. If the wall exists on just one thin venue, I treat it as noise or potential spoofing.
Troubleshooting quick hits
- Frozen screen? Hard refresh (Ctrl/Cmd + Shift + R).
- One venue missing? It might be rate-limiting or down—deselect it and try again in a minute.
- Weird gaps? Reduce the number of exchanges selected and keep only the most liquid pair.
- Mobile slowdown? Show price + trades only; save order books for desktop.
“If you don’t see any trades for 30–60 seconds on a major venue during active hours, that’s a red flag—refresh or switch it off.”
Want the exact alert stack I pair with Bitcoinity and the 60-second setup I use before reacting to headlines? I’m laying it out next—curious which three exchanges make my shortlist today?
Final thoughts and how I use Bitcoinity today
Bitcoinity keeps the signal clean: live trades, order books, and exchange share—no clutter, no login. That’s why I still keep it pinned. When I need the market’s heartbeat in seconds, it delivers.
When speed matters, a fast read beats a fancy dashboard.
Who should bookmark it
If you care about timing and liquidity, this belongs in your daily flow. A few quick examples of where it shines:
- Intraday watchers: Before reacting to a move, check which exchange is leading and whether spreads are widening. If books thin out and “walls” pull, expect slippage and choppier price action.
- Headline readers: Around macro drops (think CPI at 8:30 a.m. ET), watch for simultaneous volume bursts across multiple venues. Broad confirmation = real move. A single-venue spike often fades.
- Liquidity checkers: Weekend sessions usually run thinner. You’ll see it on the heatmap: deeper pockets stand out, spreads inch wider, and moving walls act like magnets. Market microstructure research has long shown that visible liquidity can influence short-term path and pace—this is a quick way to see it in action.
- Execution-conscious traders: If you’re about to place size, a 10-second glance at depth and spread across two or three top venues pays for itself in avoided slippage.
A simple next step
Set it up once, then let it work for you:
- Pick your main pair (BTC/USD or BTC/USDT) and two to three liquid exchanges you trust.
- Keep trades and the order book heatmap visible. That combo shows both pace and intent.
- Watch for walls that move closer to price during momentum—those levels often get tagged. If big orders keep backing away, momentum is more fragile.
- Pair it with an alert tool you already use. Let alerts ping you; use Bitcoinity as the live context window to avoid knee-jerk decisions.
- If one venue looks stale, toggle it off and focus on the active feeds. Don’t overthink it—speed over perfection.
Bottom line
I treat Bitcoinity as a go-to live market window for Bitcoin. It’s not trying to replace your entire stack—and that’s the strength. Keep it handy, glance at it before acting, and you’ll make faster, calmer decisions. When the tape speeds up, having a clean view of trades, depth, and exchange share is the small edge that adds up.
Ready to explore Bitcoinity and other top crypto tools? Visit CryptoLinks.com for expert reviews, trusted resources, and the latest insights to elevate your trading game. Dive in now and stay ahead in the fast-moving world of Bitcoin!

