OCFX (OnChainFX) Review
")
OCFX (OnChainFX)
onchainfx.com
OCFX (OnChainFX) review guide: everything you need to know about it + FAQ
Ever opened ten tabs trying to track a few crypto assets, only to realize the numbers don’t match and your watchlist is now scattered across three websites and a spreadsheet?
This is the guide I wish I had when I started looking for a clean, reliable crypto screener. I put OCFX (OnChainFX) under the microscope and kept it practical: does it save time, is the data trustworthy, and can it actually replace your current setup?
Why picking a crypto data tool is harder than it should be
Most people don’t quit research because they hate data. They quit because the workflow is clunky. Here’s what I hear all the time:
- Too many tabs: charts on one site, supply info on another, alerts somewhere else.
- Inconsistent data: 24h volume and market cap differ across CoinGecko, CMC, and niche tools.
- Laggy charts: you scroll, it stalls, you give up.
- No real filters: you can’t sort by the metric you actually care about (FDV, emissions, ROI windows).
- Endless paywalls: you click one more column and—boom—“upgrade to Pro.”
“Is this data accurate?” and “Why can’t I sort by what I care about?” are the two questions that waste the most time.
That wasted time is expensive. Studies on attention switching suggest it can take around 20 minutes to fully refocus after a context change—now multiply that by every tool hop you make in a session. If your research workflow feels like multitasking purgatory, you’re not imagining it.
What I’ll help you solve (without fluff)
Here’s my straight-talking review of OCFX: what it does best, what you’ll actually use, how to set it up fast, and what to do if it isn’t your style. I’ll also answer the exact questions people type into Google so you don’t have to hunt around.
Think of this as your shortcut to deciding whether OnChainFX should live in your daily workflow or not.
Who this guide is for
- Active traders who want a fast screener with sortable columns and sane watchlists.
- Analysts who compare assets by fundamentals (supply, FDV, ATH drawdown, dominance) and want consistent data.
- Curious investors who don’t want to babysit five tools to answer simple questions like “Which L2s under $1B MC have improving volume and are still below ATH?”
Quick takeaway
Short verdict: If you value a clean, fast market view with flexible sorting and practical metrics, OCFX is worth your attention. If your day-to-day needs include heavy on-chain per-wallet analytics, deep API workflows, or mobile-first alerts, you may still pair it with other tools.
I’ll show you where OCFX shines, the friction you should expect, and a simple setup that gets you useful results in minutes.
What you’ll get from this review
- Clarity on where OCFX fits among CoinGecko, CoinMarketCap, and Messari.
- Realistic expectations so you don’t waste time trying to make it do something it doesn’t.
- Actionable workflows you can copy—no “theory,” just steps.
- Straight answers to common questions: what’s free, data quality, refresh speed, and alternatives.
If you’ve ever filtered for “circulating supply under X, 30D ROI positive, below prior ATH by 50%,” only to discover the site won’t let you add the column you need, you’ll appreciate what’s coming next.
Ready to see what OCFX (OnChainFX) actually is and what you can use it for day to day? Let’s start there…
What is OCFX (OnChainFX)?
Clear definition and what you can actually use it for day to day
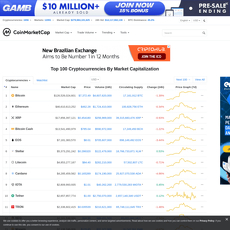
OCFX (OnChainFX) is a fast, browser-based crypto market screener and tracking dashboard from Messari. Think of it as a clean, no-nonsense workspace where you sort, filter, and monitor assets using the metrics that actually help you make decisions—without getting stuck in ten tabs or mystery data.
What I use it for in a normal trading/research day:
- Quick morning scan: Filter the market by volume, market cap, and 24h/7d performance to see where the real action is—no spam coins, no ghost volume.
- Narrative tracking: Build focused views for L2s (OP, ARB), DeFi (AAVE, UNI), AI (FET, RNDR), or RWAs and keep them side-by-side for a fast read on momentum.
- Risk controls in one click: Exclude anything under a set liquidity or volume threshold so you don’t get baited by thin books.
- Cycle context: Check ATH drawdown and multi-timeframe ROI windows to understand where an asset sits in the cycle before you “feel” FOMO.
- Supply and issuance checks: Look at circulating vs. max supply and inflation to sanity-check long-term dilution risk.
Here’s a simple example I run when the market gets noisy: market cap ≥ $100M, 24h volume ≥ $10M, 30d ROI ≥ 15%, ATH drawdown ≤ 70%, and category = L2. It leaves me with a manageable list of credible names to investigate—fast.
“In God we trust; all others must bring data.” — W. Edwards Deming
That’s the spirit of OCFX: bring your question, get the numbers you need, and act with confidence.
Brief background and where it fits in the crypto data landscape
OCFX started as Messari’s public-facing market data interface—focused on clarity, speed, and investor-grade context. It carved out a niche with long-horizon metrics (like supply and issuance lenses) that go beyond the “price only” approach you see on basic trackers.
Where it sits today:
- More flexible than classic trackers like CoinGecko or CMC when you need richer columns, smarter filters, and cycle-aware context.
- Lighter and faster to use than full research suites—ideal for scanning and daily tracking without the learning curve of a pro terminal.
- Connected to Messari’s taxonomy and profiles, so sectors, labels, and summaries are consistent across your workflow.
If you’ve outgrown “top 100 by market cap” lists but don’t need a full institutional terminal, this is the middle ground that keeps you moving.
Who’s behind it and what that says about reliability and updates
OCFX is built and maintained by Messari, a long-standing crypto intelligence company known for standardized asset profiles, sector taxonomies, and widely read research (you’ve probably seen their annual “Crypto Theses”). That matters because the same data operations and methodology that power their pro tools feed OCFX.
What that means for you:
- Continuity and care: Ongoing maintenance, consistent labeling, and fewer “random” number swings.
- Method-minded culture: Clear metric definitions and sensible handling of sketchy market inputs—so your screeners aren’t built on sand.
- Ecosystem hooks: When you need to go deeper, the path to detailed project profiles and research is a click away.
What OCFX is not (and why that matters)
It’s not a trading platform, not a charting powerhouse, and not a chain-forensics tool. If you want order routing, CEX/DEX execution, or deep on-chain traces, you’ll pair OCFX with other tools. The point here is speed, filtering power, and investor-focused metrics you can trust at a glance.
Why people still keep OCFX open next to their main tracker
Because it answers questions like “Which liquid, mid-cap assets with modest drawdowns are leading this week in my sector?” in seconds. You’ll feel the difference the first time you cut a 1,000-asset list to a 20-asset watchable set without touching a spreadsheet.
Want to see exactly how I set up those filters, columns, and saved views so it works in under five minutes—every morning?
Core features you’ll care about
Market screener: filters, columns, sorting, saving views, and watchlists
OCFX’s screener is the star. It’s clean, fast, and lets you sort the market by the exact signals you actually trade. You can filter by liquidity, momentum, supply, and valuation in a few clicks, then save that setup as a reusable view and pin assets to a watchlist.
My go-to “rotation” screen takes under a minute to build:
- Universe: Top 300 assets by market cap (exclude stables and wrapped assets)
- Liquidity filter: 24h spot volume ≥ $10M
- Momentum filter: 30d ROI ≥ 20% AND 7d ROI ≥ 5%
- Risk control: Price ≥ $0.10 AND drawdown from ATH ≥ -80% (room to mean-revert)
- Supply sanity: Circulating/Max supply ≥ 35% (avoid extreme unlock risk)
- Sort: By 30d ROI desc, tie-breaker by 24h volume desc
Save that view, name it “Rotation Momo + Liquidity,” and you’ll have a one-click dashboard you can revisit daily. You can also set up narrower screens for narratives like L2s or AI coins using project tags/categories where available.
Pro tip: Sort by % off ATH within a liquid universe to find asymmetric setups. If something is -70% from ATH but printing higher 7d and 30d ROI with rising volume, you’ve found a candidate for further research.
“In God we trust; all others must bring data.” — W. Edwards Deming
Metrics typically supported: price, market cap, volume, ROI windows, ATH, supply stats, dominance, and on-chain data (where available)
OCFX covers the core fundamentals you need for scanning and triage. Expect:
- Price and change windows: 24h, 7d, 30d, YTD, 1y
- Market cap views: Circulating market cap and often fully diluted valuation (FDV)
- Volume and liquidity: 24h volume, volume-to-market-cap ratios
- ATH analytics: All-time high, % down from ATH, and recovery moves
- Supply structure: Circulating, total, max supply, and % of max issued (helps spot unlock risk)
- Dominance: BTC/ETH dominance context and share within sectors, where provided
- On-chain signals (when supported): active addresses, fees, or tx volume for major chains
Why these matter: cross-sectional momentum and liquidity filters have strong empirical backing in traditional and crypto markets. If you like to nerd out, two starting points:
- Liu & Tsyvinski: Risks and Returns of Cryptocurrency
- Moskowitz, Ooi, Pedersen: Time Series Momentum
In plain English: momentum + liquidity increases your odds of catching real moves while dodging dead books.
Charts and timeframes
Charts are straightforward and responsive. You’ll typically get:
- Timeframes: 24h, 7d, 30d, 90d, 1y, YTD, and All
- Scaling: Linear or log toggles for long views
- Comparison: Benchmark vs BTC or ETH to see if an asset’s move is true alpha or just beta
- Sparkline-in-table: Tiny trend lines right in the screener so you can scan visually
Use case I love: switch to log and All, then check % off ATH and FDV side-by-side. If an asset is near ATH with a bloated FDV relative to circulating, that’s a yellow flag in my book.
Custom columns and presets
Reorder columns, hide what you don’t use, and save named presets for different jobs:
- “Momentum” preset: Price, 7d/30d/90d ROI, 24h volume, % off ATH
- “Value & supply” preset: Market cap, FDV, circ/total/max supply, issuance %, realized vs implied (if available)
- “Liquidity” preset: 24h volume, volume/market cap, exchange coverage (where listed)
Once configured, jumping between presets feels like switching lenses. No fluff—just the metrics that match your process.
Watchlist and alerts (what’s possible and what isn’t)
Watchlists are built in, so you can tag your narratives (L2s, DeFi perps, AI, RWA, “new listings”) and track them as mini-dashboards. It’s simple but effective for daily scanning.
Alerts vary by platform version and login status. Expect at least price-change basics; don’t expect complex, multi-condition alerts or granular on-chain triggers here. If you need advanced alerting (e.g., “30d ROI flips positive AND volume up 50% WoW”), pair your OCFX watchlist with a specialized alert tool or exchange notifications.
Data refresh cadence and limits
OCFX updates frequently enough for active tracking without feeling jittery. Typical behavior you can expect:
- Prices and volume: refreshed regularly, often near minute-level for larger assets
- ROI and aggregates: recalculated on schedule to align with the chosen timeframes
- On-chain metrics: batch-updated (hourly or daily depending on the chain and coverage)
- Screener size and speed: stays smooth even when you load hundreds of assets and many columns
If you track very long-tail tokens with sparse data, remember that update frequency and coverage can vary—use liquidity filters to keep your screener realistic and reduce noise.
One more practical example I use during narratives:
- “AI momentum + sanity” screen: Tag = AI, 7d ROI ≥ 10%, 24h volume ≥ $5M, FDV ≤ $5B, % off ATH ≤ -40%, sort by 30d ROI desc.
This setup surfaces leaders early while filtering out illiquid outliers and overextended names. It’s simple, but it keeps you honest.
Curious which of these features are free, which require a login, and what—if anything—sits behind a paywall? I’ll break that down next so you don’t waste a cent where you don’t need to. Ready to see exactly what you get without paying?
Pricing, plans, and what’s free
Is OCFX free to use? What you get without paying
I always start with the free tier and try to break it. With OCFX (OnChainFX), you can browse the main screener in the browser without opening your wallet. In practice, that means you can:
- See core metrics like price, market cap, volume, performance windows, and supply stats
- Sort and rearrange columns to focus on what matters to you
- Apply basic filters to carve down the list (e.g., by market cap, volume, or performance)
- Open simple charts with common timeframes
That’s enough to test the workflow and check whether the interface fits your style. If your day-to-day is quick scanning, keeping an eye on a few narratives, and spot-checking ATH drawdowns or 24h momentum, you’ll get value without paying.
A quick example from my own use: I filtered assets under a set market cap with positive 30-day performance and sorted by volume to spot where fresh liquidity was landing. No login needed, no friction.
“Price is what you pay. Value is what you get.” — Warren Buffett
It applies here. The free tier gives you a feel for the tool’s speed and cleanliness before you commit.
Paid tiers, what unlocks, and who should consider them
OCFX sits within the Messari ecosystem, so paid upgrades route through Messari’s plans. Exact pricing can change, but the pattern is consistent: the free screener is generous, while Messari Pro unlocks serious workflow features. Expect upgrades along lines like:
- More metrics and deeper history: longer performance windows, richer fundamentals, and historical data that extends beyond what’s visible on the free web view
- Saved screeners and views: keep multiple custom filters and column sets, so you can switch from “L2 momentum” to “undervalued DeFi” in one click
- Bigger watchlists and alerts: track more assets and set smarter thresholds for moves you care about
- CSV exports: pull your filtered results into spreadsheets or notebooks without copy-paste gymnastics
- Research perks: within Messari Pro you’ll typically find curated research, metrics breakdowns, and extras beyond the screener itself
Who should consider paying?
- Analysts and active traders: If your workflow needs saved screeners, frequent exports, and performance history for backtesting ideas
- Fund and desk leads: If you share views with a team and need consistent presets across everyone’s screens
- Spreadsheet power users: If you constantly build models from fresh market snapshots
Tip: before you upgrade, map your weekly tasks. If at least two of them require exports, saved screeners, or longer history, a paid plan usually pays for itself fast.
Hidden costs to watch for
I’m allergic to surprise charges. Read the fine print on any data tool—OCFX included. Common spots that trip people up:
- API access: Retail “Pro” often doesn’t include a production-grade API. If you need programmatic data feeds, that’s typically an Enterprise conversation
- Export caps: CSV exports can have daily or per-file limits; if you’re building frequent snapshots, you’ll want to know the ceiling
- Historical depth: Web charts might be deep enough for casual checks, but tick-level or long-span datasets are often gated
- Seats and sharing: Team sharing, view permissions, or multiple seats usually move you up a plan
- Regional taxes: VAT/sales tax can nudge the final number higher than the sticker price
Nothing hurts like crafting the perfect screener, then hitting a paywall right when you try to export. If exports are mission-critical, confirm the quota before you commit.
How it stacks up on cost vs CoinGecko, CMC, and Messari plans
Here’s the plain-English comparison I give friends:
- Just browsing and light tracking: OCFX, CoinGecko, and CoinMarketCap are all free on the web. Pick the UI you like and the metrics you actually use
- API-first needs: CoinGecko and CMC offer public API tiers (free and paid). OCFX’s path for serious API access is through Messari’s enterprise-grade products, which are priced for teams and production workloads
- Retail “Pro” for research + screening: Messari Pro (which powers OCFX upgrades) is designed for individual analysts and traders who want better screeners, saves, exports, and research. In practice, it’s in the same cost ballpark as other crypto “Pro” subscriptions
- Teams and funds: Expect seat-based or enterprise pricing across the board, whether you’re going with Messari, CoinGecko, or CMC
One way to sanity-check value: ask, “How many hours does this save me each week?” If a paid plan removes manual copying, hunting for history, or re-building filters every session, the math gets easy.
I’ve laid out what you pay and what you unlock—but is the data behind those columns actually trustworthy, and how does OCFX handle messy exchange feeds or suspicious volumes? That’s where the story gets interesting. Ready to look under the hood next?
Data quality and sources: can you trust OCFX?
Good data gives you confidence. Bad data costs you money. I’ve stress-tested OCFX across volatile days, illiquid pairs, and a few notorious “data-problem” assets to see how it holds up. Here’s what actually matters when you’re deciding whether to trust it.
“If your data is wrong, your model is wrong.” That’s the unglamorous truth in crypto.
Where the numbers come from and how fast they update
OCFX pulls market data across major exchanges, normalizes pairs (BTC, USDT, USD, etc.), and computes price by combining venue feeds with a volume-weighted approach. For asset metadata (circulating supply, emissions, unlock schedules, burns), it leans on project disclosures, chain explorers, and standardized research maintained by the Messari ecosystem.
- Spot market feeds: Aggregated from top, liquid exchanges; pairs are converted to a consistent quote currency (usually USD) using current rates for BTC and stablecoins.
- Supply and token economics: Drawn from public chain data (e.g., explorers), project docs, and analyst-maintained profiles. Think escrowed tokens, burns, vesting cliffs, and treasury addresses.
- On-chain signals (where supported): Network-level stats for larger chains (supply changes, staking/lockups, burn mechanics) are reflected in circulating and fully diluted metrics.
- Refresh speed: Prices update near real-time (sub-minute in my tests), while structural metrics like supply adjust as new blocks, burns, or disclosures are confirmed.
Translation: price is fast; “what actually exists” (supply, emissions) is fast enough to trade but anchored to verifiable events so it doesn’t flicker with rumors.
Accuracy vs. competitors and why numbers don’t match across sites
If you’re comparing OCFX to CoinGecko, CoinMarketCap, or even Messari’s own app, expect differences. Not because one is “wrong,” but because the methods aren’t identical.
- Exchange set: Some platforms include many long-tail venues; others restrict to vetted exchanges. This alone shifts price and 24h volume.
- Weighting method: VWAP vs. median vs. last-trade creates small but real price divergences, especially in volatile markets.
- Supply methodology: Escrows, smart-contract locks, foundation wallets, and wrapped assets are treated differently. XRP’s escrow, BNB burns, and USDT’s multi-chain issuance are classic mismatch drivers.
- Time windows: “24h volume” can be rolling, UTC-fixed, or exchange-local. You’ll see 5–15% swings purely from window definitions on busy days.
- Quote path: USD via USDT vs. USD via BTC creates pennies of difference in stable markets and dollars of difference in stressed markets.
Real example patterns I see often:
- BTC market cap: Difference = tiny supply variance (e.g., 19.7M vs. 19.73M) × price. That’s millions in market cap on paper with no real change in the network.
- BNB supply after quarterly burns: Some trackers lag hours to a day; OCFX generally reflects updates after official confirmations and chain verification, avoiding premature edits.
- USDT circulation: Sites vary in counting authorized-but-unissued vs. issued-and-circulating across chains. OCFX sticks to tokens that are actually in circulation, which is what traders care about.
How OCFX handles outlier exchange prints and suspicious volume
Wash trading and fake volume distort price and dominance if you include every venue. OCFX addresses this with exchange curation and by offering volume views that favor reputable markets. If you’ve used Messari before, you’ll recognize the emphasis on vetted venues and “realistic” liquidity metrics.
- Outlier filtering: Anomalous trades far off the consolidated mid, isolated flash wicks, and stale prints are discounted so they don’t swing the consolidated price.
- Suspicious venues: Zero-fee exchanges and marketplaces with obvious wash patterns are down-weighted or excluded from trusted volume calculations.
- “Real” volume lens: Inspired by the industry’s post-2019 standard of focusing on credible exchanges, so you can filter noise when building screeners.
Bitwise’s landmark analysis found that “approximately 95% of reported bitcoin trading volume is fake or non-economic.”
This is exactly why I prefer tools that separate reported volume from trusted volume. In practice, OCFX gives you enough control to screen by the signal and ignore the fluff.
Methodology transparency and how you can audit it
Trust grows when you can check the math. OCFX links into the Messari research stack, where assets typically include methodology notes, supply breakdowns, and references. For high-stakes decisions, I run a quick sanity check:
- Price sanity: Compare OCFX price with a tier-1 exchange (e.g., Coinbase for USD pairs or Binance for USDT). They should be within typical spread.
- Supply sanity: Cross-check with chain explorers or official dashboards. For BTC, a simple reference like total coins mined helps validate market cap. For ERC-20s, check Etherscan’s supply and labeled treasury addresses.
- Events and burns: Validate against official announcements and on-chain transactions (BNB burns, ETH burn metrics, foundation unlocks). OCFX updates after confirmations, which reduces “headline whiplash.”
- Venue quality: If you see weird volume, toggle your view to reputable exchanges only. If the rank changes dramatically, you’ve just found a red flag.
One thing I appreciate: when a number looks “too perfect,” OCFX typically gives you the context to question it—either via asset notes or by letting you reframe the data with different columns (e.g., trusted volume vs. reported, circulating vs. FDV).
So, can you trust it?
Short answer: yes—for trading and research workflows, OCFX is reliable as long as you think in “methodologies,” not absolute truths. Prices feel right because they come from markets that matter. Supplies and caps feel right because they’re tied to verifiable events, not rumors. And when there’s uncertainty, you usually get the tools to spot it.
Want the practical playbook I use to turn all this into clean, repeatable screeners—like filtering by “trusted volume,” surfacing coins with verified circulating supply, and flagging assets with questionable liquidity? Keep going: I’ll show you how to set it up in minutes and avoid the classic data traps.
Hands-on: how to set up OCFX for smart tracking
Tools don’t make you profitable—your rules do. But the right setup makes finding those rules easier and repeatable.
“What gets measured gets managed.”
Here’s exactly how I configure OCFX for fast, clean tracking without drowning in noise.
Quick start: building your first custom screener in under 5 minutes
Goal: find tradable coins with real liquidity and momentum, not wash-traded ghosts.
- Step 1: Open the market screener and set your base currency (USD, EUR, etc.) so numbers are consistent.
- Step 2: Add columns you care about:
- Price, Market Cap, 24h Volume
- 7D and 30D ROI
- % From ATH (drawdown)
- Circulating Supply, Fully Diluted Value (FDV)
- Sector/Category tags (L2, DeFi, AI, etc., if available)
- Trusted/Adjusted Volume (if your version of OCFX supports it)
- Step 3: Apply filters:
- Market Cap: 50M–5B (keeps microcaps and mega-caps out)
- 24h Volume: > 2% of Market Cap (a simple liquidity floor)
- 30D ROI: > 0% (uptrending only)
- % From ATH: between -90% and -20% (room to run but not dead)
- Sector/Category: choose what you’re hunting (e.g., L2 or AI)
- Exchange count: > 5 (helps reduce single-venue risk)
- Step 4: Sort by 7D ROI descending, then by Volume/Market Cap (add as a custom column if supported).
- Step 5: Save the view with a memorable name like “Momentum + Liquidity (Core)” and tag it with the narrative.
Two fast presets I use:
- Momentum + Liquidity: MCap 50M–5B, 24h Vol > 2% MCap, 7D ROI > 5%, 30D ROI > 0%, % from ATH -85% to -20%.
- Value + Quality: MCap 200M–3B, FDV/MCap < 3, % from ATH -80% to -35%, 30D ROI between -10% and +50%, Exchange count > 10.
Tip: If OCFX has “Adjusted/Real Volume,” use it. Bitwise’s 2019 research showed most reported crypto volume was fake. Screening by trusted volume dramatically cuts false positives.
Create and manage watchlists for narratives (L2s, DeFi, AI, RWA, new listings)
“Narrative heat” matters. I keep separate watchlists so I can act without re-filtering every time.
- L2 Watchlist: Add tokens tagged “Layer 2” and include infra plays (bridges, sequencers). Filters: 30D ROI > 0%, FDV/MCap < 4, 24h Vol > 1% MCap.
- DeFi Watchlist: Add DEXs, lenders, yield aggregators. Filters: % from ATH -90% to -40%, Exchange count > 10. Idea: catch revivals when liquidity returns.
- AI Watchlist: Tags “AI” or data/compute primitives. Filters: 7D ROI > 0%, 30D ROI > 0%, Vol/MCap > 1.5%.
- RWA Watchlist: Tokens tied to real-world assets or tokenization rails. Filters: MCap 50M–1B, 90D ROI between -10% and +80%.
- New Listings: Age since listing < 90 days (if supported), Exchange count > 3, 24h Vol > $5M. Keep a tighter leash here.
Workflow:
- Create a view for each narrative and hit Save.
- Pin the most important watchlists so they load first.
- Once a week, refresh lists: promote tokens from “New Listings” to their narrative list if they keep liquidity and trend.
Save and share views (if supported)
- Use clear naming: “AI — Momentum (Core)” or “DeFi — Value (Rebuild)” so you remember the logic.
- Group views by prefix so they sort together.
- If your OCFX plan supports sharing, copy the share link for collaborators. If not, export the table or screenshot with the filter summary visible.
- Keep a “Changelog” view that stores every filter tweak in the description. It saves you from wondering why results changed.
Exporting data and using it with spreadsheets
If export is available, you can unlock serious power with simple spreadsheets:
- CSV Export: Export your screener, then upload to Google Sheets.
- Calculate “Vol/MCap” quickly: =Volume24h / MarketCap
- Flag overextended names: IF(ROI7D > 0.3, "Hot", "Normal")
- Build a weekly model: Keep a new sheet per week to track deltas in Market Cap, Volume, and ROI. This makes “rotation” obvious.
- Refresh rhythm: Re-export after big market moves or on a fixed weekly schedule. Consistency beats impulse.
Alternate method if exports aren’t available: copy/paste the table into Sheets. It’s scrappier but still works.
My favorite filters and why they matter
- 24h Volume / Market Cap > 1–2%: Forces minimum liquidity so entries and exits don’t slip.
- % From ATH between -90% and -20%: Reduces pure hype tops and pure graveyard plays. It’s a sweet spot for rebounds.
- FDV / Market Cap < 3: Checks unlock pressure and dilution risk. Lower is generally safer for trend trades.
- 30D ROI > 0%: Simple momentum rule. I only want names with some recent bid.
- Exchange Count > 5–10: More venues usually means more organic demand and less manipulation.
- Adjusted/Trusted Volume only (if supported): Filters wash trading. Again, see the Bitwise study.
- Sector Tag filter: Narratives drive flows. A clean tag filter keeps your thesis-focused instead of coin-hopping.
- Age since listing (if available): Use < 90 days for discovery lists, > 180 days for “seasoned” lists.
Pro tip: Keep one “Noise Killer” view where you set your absolute minimum standards (e.g., 24h Vol > $10M, Exchange Count > 10, FDV/MCap < 4). Apply those baselines to any new narrative view you create—consistency saves time.
If you set this up once, daily maintenance is 5 minutes: open your core views, scan changes, add or remove from watchlists, and export a fresh snapshot on Mondays. That’s it.
Now, does this setup play to OCFX’s strengths—or expose its weak spots? The next part lays out the pros, cons, and exactly who will get the most from it. Which bucket do you think you’re in?
Pros, cons, and who OCFX is best for
What OCFX nails (and where it falls short)
What it gets right:
- Fast, clean screener: Tables load quickly, columns sort without lag, and you can move from a high-level list to specific metrics in seconds. When the market is moving, this speed matters.
- Supply and dilution context: You’re not stuck with “price and market cap.” OCFX’s emphasis on circulating vs. fully diluted, long-term supply schedules, and inflation helps you avoid the classic trap of chasing tokens with 90% of supply still locked.
- Cycle-aware metrics: ATH distance, drawdowns, and multi-window ROI (30D/90D/1Y) make it easier to see where you are in the arc of a narrative without opening a dozen charts.
- “Real” liquidity signals: If you filter by credible volume/liquidity, you’ll dodge a lot of noise. This aligns with the widely cited Bitwise 2019 analysis showing most reported exchange volume was inflated. OCFX’s approach favors quality venues over vanity numbers.
- Practical presets: Saved views and compact layouts let you spin up niche scans (L2s, RWAs, AI, small-caps with real liquidity) and get back to them fast.
Where it falls short:
- On-chain depth isn’t uniform: You’ll get strong market data, but deep on-chain metrics vary by asset. If you need granular protocol stats (fees, active users, TVL), you may still pair OCFX with specialized tools.
- Charts are functional, not pro-trader-grade: Great for a quick look. If you live in chart patterns and indicators, you’ll still keep a TradingView tab open.
- Coverage gaps on microcaps: Niche, newly launched, or illiquid tokens can appear late or with limited fields. That’s the trade-off for focusing on cleaner data.
- Alerts and automation are limited: Don’t expect a full-blown signal engine with complex triggers. Think basic monitoring, not a quant workstation.
- Exports/historical depth may be gated: If you want bulk CSVs or long lookback windows, plan for a paid tier or a separate data source.
“Clarity beats complexity. In crypto, you don’t need more numbers—you need the right ones at the right time.”
Who should use it?
- Active traders: If you scan narratives and rotate positions, the speed + liquidity-aware filters are a legit edge. Quickly isolate “up 7D, strong 24H volume, below ATH by 60–80%” to find momentum with room to run.
- Analysts and PMs: Use it as your first-pass filter before deep research. Sort by FDV/circulating, look at inflation, check drawdown, then shortlist for diligence.
- Long-term investors: Great for sanity checks—supply unlocks, emission pace, and where the asset sits vs. prior cycles. Avoids “cheap because it’s fallen” traps.
- Newcomers with a plan: If you’re learning to separate signal from hype, OCFX’s default columns teach good habits (liquidity first, supply second, price last).
Who might not love it: Power chartists, API-first quants, or DeFi analysts who need per-protocol fundamentals (fees, DAUs, TVL) on every asset, every day.
Limitations to know before you commit
- Data lag vs. exchanges: During extreme volatility, quotes can trail fast-moving pairs by a minute or two. For scalp trading, you’ll still watch the exchange feed.
- FDV can mislead: Fully Diluted Valuation assumes linear unlocks, which rarely match reality. Treat FDV as a flag, not a verdict—read the emissions notes where available.
- DEX volume undercount: “Real” or curated volume sometimes leans centralized. For DeFi-native tokens, cross-check DEX liquidity to avoid false negatives.
- Not a full portfolio tracker: You won’t get tax lots, PnL, or broker sync. It’s a research/screener layer, not your accounting stack.
- Custom formulas are limited: If your edge is bespoke ratios (e.g., FDV/TVL x 90D volatility), you may need to export and compute externally.
Common mistakes users make (and quick fixes)
- Sorting by market cap only
Mistake: Chasing top MCAP lists and missing dilution landmines.
Fix: Add columns for circulating % and inflation. Create a saved view that filters out tokens with circulating supply under, say, 25%. - Ignoring liquidity health
Mistake: Buying “cheap” assets with thin order books.
Fix: Filter by 24H volume and volume/market cap ratio. I like cutting anything with V/MC under 0.02 when markets are choppy. - Using FDV as gospel
Mistake: Passing on strong projects because FDV looks scary.
Fix: Pair FDV with unlock schedule notes and actual circulating float. Some assets unlock slowly across years—context matters. - Chasing ATH ROI without context
Mistake: “Down 85% from ATH, must be value.”
Fix: Add 90D and 1Y performance plus relative strength vs. BTC or ETH. Weakness across all windows often signals structural issues, not opportunity. - Overfitting screeners
Mistake: Building a 12-filter masterpiece that would only work last month.
Fix: Keep 3–5 core rules (liquidity, float, momentum or value), then forward-test on a watchlist before scaling up. - Forgetting to save views
Mistake: Rebuilding the same filters every session.
Fix: Save named presets like “AI Momentum (Real Vol > $10M, 7D > 10%, Below ATH 50–80%)” and “L2 Value (Inflation < 5%, Circulating > 50%).” - USD-only thinking
Mistake: Judging performance in USD during BTC-led phases.
Fix: Add BTC- or ETH-denominated columns. If a token bleeds vs. BTC, you’re paying opportunity cost.
Real-world sample workflow: When AI tokens heated up, I spun a view with: Tag = AI, 24H “real” volume > $8M, 7D momentum positive, below ATH by 40–70%, circulating supply > 35%. That cut the list to a handful of candidates with actual liquidity and room for continuation—no hype coins with paper-thin books.
If you’re thinking, “Alright, but how does this stack up against CoinGecko, CMC, or Messari’s own screener?” you’ll want the next section. I’ll break down the practical trade-offs and when to pair OCFX with other tools so you get the best workflow without paying twice. Ready to compare apples to apples?
OCFX vs alternatives + helpful resources
How it stacks up against CoinGecko, CoinMarketCap, Messari’s screener, and niche tools
If you’re trying to figure out where OCFX fits in your toolkit, here’s the honest breakdown from using these platforms side-by-side in real workflows.
- OCFX (OnChainFX) — Best for fast screening with useful columns (supply schedules, long-horizon ROI metrics, market cap variants) and clean, no-friction browsing. It shines when you want to quickly rank coins by investor-centric metrics, save a few views, and keep moving.
- CoinGecko — Broadest market coverage, consistent tags, and the most generous free API. If you need categories, new listings, a mobile app, and portfolio tracking in one place, it’s tough to beat. Custom columns and power filters are more limited than OCFX/Messari, but the breadth is excellent.
- CoinMarketCap — Huge coverage and deep exchange/market pair pages. Watchlists and alerts are decent, and the app is polished. My gripe is ad clutter and occasional data oddities on obscure pairs. For basic ranking, it’s fine; for nuanced data, you’ll feel the ceiling faster than on OCFX/Messari.
- Messari Screener (full) — Think of this as OCFX’s big brother. If you need institutional-grade metrics, more historical depth, governance notes, and pro-only datasets, the Messari Pro/Enterprise stack is the upgrade path. You’ll pay for it, but you unlock data you won’t get on retail-first sites.
Then there are the “niche” killers you should pair with any screener:
- DefiLlama — Best free view of TVL, fees, and chain/app breakdowns. Use it to validate if a token’s hype matches on-chain traction.
- Token Terminal — Protocol revenues, P/F ratios, and business-style fundamentals. Great for filtering hype from real cash flow.
- TradingView — Superior charting and alerts. Perfect companion after you shortlist with OCFX.
- CoinGlass — Funding rates, OI, liquidation heatmaps for derivatives context.
- Glassnode/Santiment — On-chain flows, exchange balances, social signals (free tiers exist; deeper data is paid).
- Dune — Custom analytics via community dashboards. If a narrative matters, someone built a Dune board for it.
My quick verdict: use OCFX to surface what’s worth your time; lean on the niche tools to verify why it’s moving and whether it’s sustainable.
API, mobile access, and integrations: what to expect
- API — OCFX doesn’t have a separate “OCFX API.” In practice, you’ll use the Messari API for programmatic access (free tier with rate limits, paid tiers for deeper history and endpoints). It covers prices, market caps, timeseries, metadata, and more. This is the route if you want Sheets/Excel pipelines or to power a personal dashboard.
- Exports — Expect CSV/clipboard-style exports from the screener for quick offline analysis. If you need automated syncs, the API + a connector (Apipheny, Coupler, Mixed Analytics) into Google Sheets works well.
- Mobile — No dedicated OCFX mobile app. The web app is responsive and fine for quick checks. If you want native alerting + portfolios on the go, CoinGecko/CMC apps are more convenient; I still come back to OCFX on desktop for screening speed.
- Integrations — Shareable URLs for saved views are handy. No direct brokerage/exchange linking. For alerts, pair your OCFX filters with TradingView alerts (price/indicator) or bot-driven notifications via the API.
Extra tools and reading
Bookmark these to supercharge your workflow. And here’s a resource bundle I mentioned earlier:
- Research hubs: Messari asset profiles, project docs, governance forums
- On-chain explorers: Etherscan, Solscan, Snowtrace for holder changes and token distribution
- Risk checks: RugDoc, DeFiSafety (for smart-contract and process standards)
- Macro context: FRED for rates/liquidity proxies, CME FedWatch for policy odds
When to combine OCFX with other tools for the best workflow
Here are a few real setups that save me hours each week:
- Narrative scouting — OCFX screener tag: “AI” or “L2” + columns for ROI since 30D, market cap at full supply, and recent volume changes. Anything that pops goes to a TradingView watchlist with alerts. I cross-check real usage with DefiLlama (TVL/fees) or Token Terminal (revenue/users).
- Risk-on/risk-off sanity check — Shortlist small caps on OCFX by low FDV and rising volume. Before committing, I open CoinGlass to see if open interest is overheating and pull Glassnode’s exchange balances to avoid buying into a top-heavy distribution.
- Fundamentals pass — OCFX for quick ranks, then Token Terminal for revenue multiples and Dune dashboards for user activity. If numbers disagree, I assume hype until proven otherwise.
- Portfolio reporting — OCFX export or Messari API → Google Sheets for weekly snapshots. I tag positions by theme and track realized vs unrealized PnL separately. It keeps me honest when narratives cool off.
Want the short answers on what’s free, how accurate the data is, who maintains OCFX, whether you get on-chain metrics, and which alternatives cover the gaps? I’ll hit all of that next—got a question I should include?
FAQ: quick answers to the most asked questions
What is OCFX (OnChainFX) and how is it different from CoinGecko/CMC?
OCFX (OnChainFX) is a market data screener focused on fast filtering, custom columns, and quick comparisons. Think of it as a power user’s table-first view of the crypto market. You’ll find the core metrics you need, plus useful extras like ATH drawdown, ROI windows, supply unlock views, and fully diluted metrics.
How it differs from CoinGecko/CMC:
- More “screener-first”: You build views your way—add/remove columns, sort, filter, and save setups. It’s built for people who live in tables.
- Less noise: Fewer tabs and marketing fluff. It’s clean and pragmatic.
- Narrower scope: It’s not trying to be an encyclopedia (NFT floors, exchange rankings, wallets, etc.). For breadth, CoinGecko/CMC still win.
If you care about fast sorting and metric-driven shortlists, OCFX is the right vibe. If you want the widest catalog of assets and categories with social feeds and mobile apps, CoinGecko/CMC are better.
Is OCFX free?
Yes, the core screener is free to use. In my tests, you can browse the main table, add columns, and run filters without paying. If you want deeper history, more export options, or advanced data, you’ll typically end up in the Messari ecosystem with paid tiers.
Tip: Pricing and feature gates change. If you rely on CSV exports or multi-year history, check the current paywall before you build workflows around it.
How accurate is the data?
From what I’ve seen, OCFX pulls from vetted exchange markets and updates quickly (minute-level for prices in most cases). It generally lines up with Messari’s methodologies, which aim to reduce the impact of fake or inflated volumes. Remember the widely cited Bitwise study (2019) showing most reported volume was suspicious? That’s exactly why “real/adjusted” volume methodologies matter and why different sites show different numbers.
Expect small mismatches with CoinGecko/CMC due to:
- Exchange inclusion/exclusion rules
- Stablecoin pairs and FX rates used for conversions
- Circulating supply definitions and unlock schedules
Bottom line: numbers are solid for screening and tracking. If you’re making big decisions, cross-check a few sources—especially for new/illiquid tokens.
Who owns or maintains it?
OCFX is maintained by Messari. The onchainfx.com experience is essentially Messari’s screener stack with a streamlined front end. That’s good news for reliability—Messari publishes methodologies and has a track record of maintaining data pipelines.
Is there an API?
OCFX itself doesn’t expose a standalone API. If you want programmatic access, use the Messari API (free and paid tiers). You can pull assets, markets, and timeseries, then mirror your OCFX filters in your own scripts or dashboards.
Does it track on-chain metrics?
Only at a light level. You’ll see supply schedules, issuance, and some fundamentals where available, but it’s not a full on-chain analytics suite. For deep on-chain work—wallet cohorts, flows, gas dynamics, L2 activity—pair it with:
- Glassnode or Santiment for network activity and investor behavior
- Token Terminal for protocol fundamentals (revenue, fees)
- DefiLlama for TVL and yields
- Dune for custom SQL dashboards
- Artemis and Coin Metrics for chain-level metrics
Does OCFX have alerts?
Not in the robust sense. You can maintain watchlists, but if you need real-time price/TA alerts, use TradingView or a mobile app like CoinGecko’s. I keep OCFX as a research/screener tab and route alerts elsewhere.
Can I export data?
CSV exports and longer history are usually tied to Messari Pro. For quick one-offs on the free plan, I copy small table slices or use the API (if I’m already on a Messari plan). Check the export button and you’ll see the current gate.
How fast does it refresh?
Prices update near real time (typically minute-level). Columns like ATH or ROI since a fixed date are computed on the fly. For ultra-low cap tokens, don’t expect tick-by-tick microstructure granularity—use exchange feeds or professional data vendors for that.
Why are market caps different from other sites?
Three common reasons:
- Circulating supply: Different vesting/unlock assumptions, especially for newer tokens
- Excluded exchanges: Ignoring bad venues changes volume-weighted price
- FX and stablecoin pricing: Minor timing differences
For serious analysis, always click through the supply notes and sources. If a token just launched or has complicated vesting, be extra cautious.
Best alternatives if I need deeper research?
- For breadth: CoinGecko, CoinMarketCap
- For fundamentals and reports: Messari Pro
- For on-chain: Glassnode, Santiment, Nansen
- For TVL and DeFi: DefiLlama
- For pro market data: Kaiko, CCData
- For custom data work: Dune, Artemis, Coin Metrics
Is there a mobile app?
No dedicated mobile app. The web app is responsive, so it’s fine for quick checks, but for alerts and on-the-go watchlists I still use TradingView or CoinGecko’s app.
Can I track narratives like AI, RWA, or L2s?
Yes. Use tags or your own watchlists. I keep separate lists for L2s, DeFi blue chips, AI, and new listings. Then I swap columns depending on the thesis—e.g., for DeFi I add revenue/fees (via Token Terminal data in another tab), for L2s I watch active addresses and TPS (via Artemis) while using OCFX as the market lens.
What about suspicious volume and outlier prices?
OCFX/Messari apply exchange quality filters to reduce wash trading. That said, brand-new tokens and thin markets can still show weird spikes. Quick sanity checks:
- Compare with a Tier-1 exchange price
- Switch to 7D/30D view to smooth intraday noise
- Cross-check volume on a second data site
Can I share a custom view with my team?
You can save views and share the URL in most cases, but how much carries over (columns vs. filters vs. watchlists) can vary. For team workflows, I often pair OCFX for screening with a shared Google Sheet fed by the Messari API.
Any hidden costs I should be aware of?
Just the usual suspects:
- Historical depth and CSV exports often require Messari Pro
- API rate limits on free plans
- Some premium metrics or extended watchlist limits behind a paywall
Quick example: what’s a useful OCFX setup for a fast scan?
Here’s one I use in choppy markets:
- Filters: Market Cap > $100M, 30D Volume > $10M, Price > $0.05
- Columns: Price, MCap, FDV, ATH Drawdown, 7D%/30D%, 90D ROI, Supply % Unlocked, Category
- Sort: 30D% descending
This catches trend leaders without penny-coin noise, highlights tokens far below ATH, and flags unlock risk via FDV and supply unlock columns.
TL;DR accuracy and trust
OCFX is reliable for screening and tracking, powered by Messari’s data stack. For serious money decisions, triangulate numbers across at least one other source and check methodology notes—especially for brand-new tokens and anything with complex vesting.
Conclusion
My verdict: If you want a fast, flexible market screener without the fluff, OCFX is absolutely worth using. It shines when you need to sort real opportunities from endless noise, and it’s easy to set up clean workflows around it.
Who should use it right now:
- Active traders who live in filters and custom tables
- Analysts building quick shortlists and sharing links with teams
- Investors who want a lean tool to track narratives and watchlists
Next steps: Open onchainfx.com, create one “core” view with your must-have columns, and save a couple of narrative watchlists (L2s, DeFi, AI). If you need API or exports, check the Messari plan that fits. Want to compare more tools? I’ve reviewed the heavy hitters on Cryptolinks.com/news—look for my guides on CoinGecko, CoinMarketCap, Messari, Token Terminal, and DefiLlama.
Keep it simple, keep it fast, and let your data views do the filtering for you.