Stats- btc.com Review

Stats- btc.com
btc.com
BTC.com Stats Review Guide: How to Read and Use It Like a Pro (with FAQ)
Ever opened a blockchain stats page and wondered, “Is any of this useful right now?” Good news: it is—if you know what to look for. If you want quick, clear answers from BTC.com Stats without getting lost in charts, you’re in the right place.
I wrote this guide to help you read BTC.com’s data the way pros do—spotting real signals, skipping noise, and actually using the numbers for better decisions, whether you’re trading, mining, running a node, or just learning Bitcoin the smart way.
The problems most people hit with BTC.com Stats
If you’ve felt overwhelmed here, you’re not alone. These are the common blockers:
- Too many charts, not enough context. It’s hard to know what actually matters—and why.
- Jargon overload. Hashrate, difficulty, mempool, fee rates… it can feel like a new language.
- Data freshness isn’t obvious. You see numbers—but are they live, hourly, daily? Can you trust them for time-sensitive decisions?
- No clear cadence. People ask, “What should I check daily vs weekly?” and rarely get a straight, practical answer.
Quick reality check: Most bad on-chain takes come from reacting to single-day swings. That’s why this guide focuses on reading trends, not just snapshots.
The promise: a clear, friendly walkthrough you can use today
Here’s what you’ll get from me as you read:
- Plain-English explanations of each important metric—what it means, what it doesn’t, and when to care.
- Actionable signals to watch, like fee spikes, retarget windows, and pool share shifts that may affect confirmations or miner revenue.
- Limits and pitfalls so you don’t overreact to noise or one-off anomalies.
For example, when the mempool ran hot during the BRC-20 minting rush in May 2023, fees jumped dramatically across short windows. If you knew how to read the sats/vB ranges, you could set expectations for confirmation times—or save money by waiting. That’s the kind of practical edge I’ll aim to give you.
Who is BTC.com, and can you trust their stats?
BTC.com is a long-running Bitcoin block explorer and mining data source that’s been around since the mid-2010s. What that means for you:
- Direct on-chain data: recent blocks, transaction details, block sizes, timestamps, miner coinbase tags, and fees paid are read from their own nodes.
- Aggregated insights: some numbers (like hashrate estimates and difficulty projections) are calculated using standard methods from the raw chain data and recent block intervals.
In plain terms: the “what happened” data (recent blocks, block rewards, transaction counts, mempool view from their nodes) is direct; the “what it implies” data (estimated hashrate, difficulty forecasts) is modeled. That’s normal across explorers. It’s also why using moving averages or looking at multi-day windows is smart—short-term noise can trick you. Independent analysis from groups like Coin Metrics and BitMEX Research has repeatedly shown that daily hashrate estimates can be volatile; 7–30 day views are far more reliable.
Bottom line: BTC.com is a credible source for live network activity and miner behavior, as long as you treat estimates as estimates and read them in context.
What exactly does BTC.com Stats include?
The stats page collects the core signals most people care about, plus quick links to dig deeper. You’ll typically find:
- Estimated Hashrate — a view of miner participation and network security. Helpful for tracking broad miner trends.
- Difficulty and Retarget Info — the current difficulty and estimates for the next adjustment (about every 2016 blocks).
- Average Block Interval — why blocks can cluster fast or slow relative to the 10-minute target.
- Mempool Size — pending transaction load; a quick gauge of congestion and confirmation pressure.
- Fee Rates — sats/vB ranges showing what users are paying right now; essential for setting sensible fees.
- Mining Pool Distribution — share by pool based on coinbase tags; useful for tracking centralization risks and shifts.
- Recent Blocks — who mined them, fees collected, size/weight, and time between blocks.
- Other tiles/charts — orphan/stale blocks, transaction counts, and sometimes price context alongside on-chain data.
A couple of real-world examples:
- Fee spikes: During high-demand events (ETF news days, major on-chain mints, or memecoin bursts), the mempool can fill and the “high priority” sats/vB band climbs quickly. Watching that band tells you whether to pay up now or wait until off-peak hours.
- Difficulty shocks: If weather or energy grids force large miners to curtail (e.g., heatwaves or winter storms), block intervals may slow and the next difficulty adjustment can swing negative, temporarily improving miner margins. You’ll see the preview on the stats page before the retarget locks in.
If you’ve ever asked, “Where do I check this fast?”—this is the right page to bookmark.
Who this guide is for (traders, miners, builders, learners)
You don’t need to be a quant to use these stats well. Here’s how different readers can get value quickly:
- Traders: Watch the mempool and fee bands to gauge near-term friction. Sudden congestion can slow exchange withdrawals/deposits and change settlement timing around key events.
- Miners: Track the retarget window, hashrate trends, and pool distribution. It helps with risk notes around expected revenue shifts—without overfitting to single days.
- Builders & Node Runners: Use mempool load and block intervals to plan maintenance windows, estimate confirmation SLAs, and sanity-check what your own node is seeing.
- Learners: Start with three tiles—mempool size, fee rates, and recent blocks. You’ll quickly connect how demand affects fees and confirmation times.
If you’ve ever thought “This all looks useful, but where do I start?” you’re about to have a simple path. Next up, I’ll show you exactly where everything lives on BTC.com Stats so you can find the good stuff in seconds. Want a fast tour that saves you 20 minutes of clicking around?
A quick tour of BTC.com Stats: layout, navigation, and what’s where
If you’ve ever opened BTC.com Stats and felt your eyes glaze over, you’re not broken—your brain is just trying to find the signal. As one of my favorite reminders goes:
“Clarity is speed.”
Here’s the fast orientation I use so I can go from “what is this?” to “got it” in seconds—no guesswork, no click-maze.
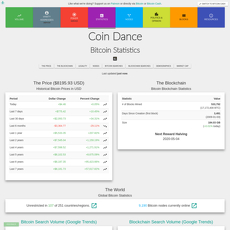
The main dashboard at a glance
The homepage is built around a set of tiles and a live feed. Treat it like a cockpit—scan left to right, top to bottom (there’s research from Nielsen Norman Group showing most of us read web pages in an F-pattern, which is exactly why the most important stats sit up top). I look for five things:
- Latest blocks: A rolling list with height, time since mined, transactions, and the pool that found each block. Quick sanity check: are blocks landing roughly consistently or have there been long gaps?
- Hashrate (EH/s) and difficulty: Usually shown as headline numbers with a sparkline or link to a chart. These hint at miner participation and how “hard” blocks currently are.
- Block interval: The average time between blocks over a recent window. If it’s notably above ~10 minutes, confirmations may feel slower; if below, they feel snappier.
- Mempool size and fee rates: Unconfirmed transactions and typical fee ranges (sats/vB). This is the “cost to get in” right now.
- Mining pool distribution: A pie or bar view showing which pools found what share of recent blocks.
How I read this in context, fast:
- Fees + mempool together: If fees read 60–80 sats/vB and the mempool shows a heavy backlog, I know low-fee transactions will wait. If fees are sub-5 sats/vB and the mempool looks thin, it’s a good time to broadcast bigger batches or consolidate UTXOs.
- Latest blocks + interval: Seeing a couple of blocks land within minutes doesn’t mean the next one is “due.” That’s randomness. I just confirm the average interval trend and move on.
- Pools: If one pool grabbed an unusually large share over the last 24 hours, I click through (more on that below) to see if it’s a real shift or just variance.
Real sample: earlier this year during a weekend inscription rush, I watched the mempool tile jump from a sleepy backlog to “packed” within an hour, while fee tiles climbed from single digits to 90+ sats/vB. Spotting that combo early let me bump my fee and still confirm in the next block. If I’d only looked at the last-24h average chart, I would have been late.
Navigation tips that save time
You can get everything important in 2–3 clicks if you know where to poke. Here’s what I do:
- Click tiles, not just menus: Most tiles link to their deeper chart or a related page. If you’re staring at “Hashrate,” click it—don’t hunt through menus.
- Use the top navigation to jump between views: Stats, charts, pool distribution, recent blocks, and transaction pages are all one hop away. When I’m comparing two views, I Ctrl/Cmd + click to open in a new tab and keep my place.
- Follow the breadcrumbs: On block or transaction pages, use the breadcrumb links near the top to snap back to stats or the pool view. No need to mash the back button.
- Legend toggles and tooltips: On charts, hover to see exact values; click legend items to hide series and isolate what you care about. If the lines look noisy, I turn off the busiest series first.
- Bookmark your “state”: After choosing a timeframe (like 7D or 30D), copy the URL and bookmark it. I keep three: mempool/fees short-term, hashrate 7D, and pool share 30D.
- Open pool names and block heights: From the pool distribution or latest blocks, click a pool name to see its recent finds; click a block height to jump into block details and fees paid in that block.
Small UX truth: the fastest path is rarely in the burger menu. I click the stat I’m curious about first—9 out of 10 times it’s a shortcut to the exact page I wanted.
Data freshness and timeframes
Not all numbers update on the same schedule, which is why people get tripped up. Here’s the practical way to think about it:
- Blocks and mempool: Near real-time. You’ll see new blocks pop in seconds after propagation. Mempool and fee tiles refresh frequently (think seconds to a minute).
- Hashrate: Estimated from recent blocks; volatile in short windows. For decisions, 7D or 30D views are more trustworthy than “today.”
- Difficulty: Only changes every ~2016 blocks. Looking at it hourly doesn’t add much—daily or retarget-window views are better.
- Fee ranges: Short windows matter. If you’re about to broadcast a transaction, use the hourly view (or even “last few blocks”) to set fees realistically.
When I prefer hourly vs daily:
- Hourly: Fees, mempool size, recent block interval. Great for “should I send now?” calls.
- Daily/Weekly: Hashrate, difficulty, pool share. Good for understanding trends rather than reacting to noise.
Quick sanity trick: if an hourly chart looks scary, I switch to 7D. If the spike vanishes at that scale, it’s likely a short-lived burst. If it still sticks out, that’s a real event.
Why this works is simple cognitive science: short windows can fool our pattern-seeking brains. Longer windows reduce false alarms. Nielsen Norman Group’s research on attention and scanning backs this up—when information overload hits, we skim and overreact. Zooming out helps you think instead of flinch. If you’re curious, check their classic piece on how people read online: F-shaped pattern for reading web content.
Desktop vs mobile experience
I switch setups depending on what I’m doing:
- On desktop (research mode):
- Keep three tabs side by side: Stats, Mempool/Fees, Pool Distribution. Snap windows so you can glance without switching.
- Use timeframe buttons to align views (e.g., all set to 7D) so your comparisons are apples to apples.
- When a chart looks cramped, hit any available “expand” or “full screen” control. It’s easier to spot outliers when the y-axis has room.
- On mobile (decision mode):
- Portrait for tiles; rotate to landscape for charts if labels feel tight.
- Tap the fee and mempool tiles first; that’s 80% of what you need before sending a transaction.
- Add the stats page to your home screen for one-tap access. On iOS/Android browsers you can use “Add to Home Screen.”
- If you’re on a slow connection, stick to the tiles and latest block list. Heavy multi-series charts can be choppy on low bandwidth.
Speed matters for comprehension too. Google’s analysis of mobile behavior found that as page load time goes from 1s to 3s, the probability of bounce increases by 32%+ (source: Think with Google). Translation: keep your routine tight, and you’ll actually use the data instead of abandoning it.
One more real-world example: during a weekday morning fee surge (common when Asia/EU and US hours overlap), I only check two tiles on my phone—mempool size and the current fee band. If mempool is packed and the median is high, I wait until the next lull. If I absolutely must send, I pull up the latest block list, open a couple of recent blocks, and peek at what fee rates actually got in. That’s a 60-second check that often saves money and time.
Now that you can find everything without clicking in circles, how about making sense of what those metrics really tell you—and what they definitely don’t? In the next section, I’ll explain each stat in plain English and share a few traps to avoid so you don’t get fooled by noise. Want the hashrate myth most people still believe? I’ll show you exactly where it breaks down.
BTC.com’s key metrics explained in plain English
If you’ve ever stared at the BTC.com stats page and felt that little knot in your stomach—“am I reading this right?”—you’re not alone. Let’s turn those tiles and charts into things you can trust and use. I’ll keep it simple, then add the small tricks I use to avoid getting fooled by noise.
“Short‑term noise is the toll we pay for long‑term security. Learn to spot it, then drive right past it.”
Hashrate: what it actually tells you (and what it doesn’t)
What it is: BTC.com estimates total compute power currently mining Bitcoin, inferred from recent blocks. More hashrate generally means stronger security and more miners competing to find blocks.
How I read it:
- Use moving averages. The daily line can be spiky because it’s inferred from luck in block discovery. I flip to the 7‑day or 30‑day view to see the real trend. If BTC.com shows a sudden 10% drop on the 1‑day, I assume it’s noise until the weekly view confirms it.
- Seasonal and regional shifts happen. Maintenance, power curtailment during heat waves, or energy price spikes can push hashrate around temporarily. A few down days aren’t “miners capitulating.”
- Big picture: A steady climb in the 30‑day average is a healthy sign for network security. Flat or slowly declining for weeks may foreshadow softer difficulty and slightly faster blocks later—useful context for fee timing.
Reality check: Estimated hashrate is not a live “sensor.” It’s modeled from block intervals, and randomness can trick you in the short run. That’s why I never draw conclusions from a single day.
Difficulty and retargets
What it is: Every ~2016 blocks (about two weeks), Bitcoin adjusts “difficulty” so blocks keep landing about every 10 minutes. If blocks came too fast, difficulty rises; too slow, it falls. Changes are capped so they can’t swing more than 4× in one go.
How I read it:
- Watch the ETA and “next adjustment” estimate on BTC.com. If it’s projecting +4% and there are only ~300 blocks left, that’s a solid preview for miners’ near‑term revenue per TH/s.
- Large positive retargets tell me miners added meaningful hashrate recently (or got lucky). Large negative retargets suggest some miners unplugged or an energy event hit them.
- For fee planning: After a big downward adjustment, blocks tend to speed up for a while, which can help drain the mempool and ease fees—especially if demand cools at the same time.
Tip: Pair the “remaining blocks to retarget” with hashrate trend. If hashrate is rising and we’re early in the epoch, the final adjustment may end up larger than today’s estimate.
Block interval and why blocks aren’t always “every 10 minutes”
What it is: The average time between blocks over a chosen window. The target is ~600 seconds, but blocks arrive randomly. Statistically, block arrivals follow a Poisson process, so streaks of fast or slow blocks are normal—even a 30‑minute gap happens sometimes.
How I read it:
- Short windows swing wildly. A 1‑hour average above 12 minutes doesn’t mean the network is “broken”—it’s likely just variance. I balance the 1‑hour with the 24‑hour view.
- When it matters: If the 24‑hour average stays slow while the mempool is growing, I expect higher fees and longer confirmation times for low bids.
- Fun reality check: Academic work on Bitcoin’s timing randomness backs this up—bursts and droughts are normal even when the system is healthy.
Sample scenario: One quiet weekday, BTC.com showed several 20+ minute gaps back‑to‑back. Fees didn’t budge because the mempool was tiny. A few days later, demand spiked; even 10–12 minute averages felt slow, and fees soared. Context beats raw numbers.
Mempool size and fee rates
What it is: The mempool is the waiting room for unconfirmed transactions. BTC.com shows how full it is and fee rate ranges (sats/vB). Miners pick higher fee transactions first.
How I read it:
- Look at fee buckets, not just “mempool size.” The distribution of sats/vB tells you where the bidding war is. If most of the queue sits above 50–80 sats/vB, low bids will wait.
- Spikes have stories. On 2023‑05‑07 and again around the 2024 halving (when new token schemes like BRC‑20/Runes surged), fees jumped into the hundreds of sats/vB for hours. Some blocks earned tens of BTC in fees—well above the subsidy. That wasn’t “broken,” it was demand.
- Relief signals: A falling high‑percentile fee bucket and a shrinking mempool usually means you can drop your bid and still confirm in a few blocks.
- Weekend effect: Fee floors often dip on weekends or off‑peak hours. If it’s not urgent, wait for those windows.
Rule of thumb I use:
- Urgent: pay at or above the current “high” bucket BTC.com shows.
- Soon (next few blocks): aim around the median bucket.
- Not urgent: pick a low bucket and watch; bump later if needed.
Why this works: Studies of mempool behavior show bursts are common when new protocols or market events hit; the fee market clears as blocks include the highest bidders first. Reading the buckets saves you guesswork.
Mining pool distribution
What it is: Share of recent blocks by pool (Foundry, Antpool, F2Pool, etc.). BTC.com’s chart helps you see concentration risk and short‑term shifts.
How I read it:
- Watch the top pools’ combined share. If one pool sustains north of ~33% for long periods, I keep an eye on it. Diversity is healthier.
- Short‑term jumps aren’t always structural. Promotions, luck, or temporarily connecting hosted hashrate can move shares for a few days. I check the 7‑day and 30‑day views before I worry.
- Miners’ strategy: When fees spike, some miners switch pools or payout modes for better incentives. You’ll see that rotation in this chart.
Note: Pool attribution is based on coinbase tags and known addresses; it’s accurate enough for trends, but individual blocks can be misattributed occasionally.
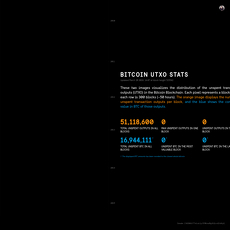
Other useful tiles and charts
- Orphan/Stale blocks: These happen when two miners find a block at almost the same time and the network resolves to one chain. Research like Decker & Wattenhofer (2013) linked stale rates to propagation delays; in practice today it’s typically well under 1%. A sudden cluster can hint at temporary network hiccups or fierce competition at high hashrate.
- Transaction counts and weight: Lots of tiny inscriptions can inflate counts without moving value. I pair this with fee buckets to see if demand is “spammy” or real economic activity.
- Price context: If BTC.com shows price alongside on‑chain metrics, treat it as just that—context. Price and fees sometimes move together during hype, sometimes not. Don’t assume causation.
Putting it all together fast:
- Check the 7‑day hashrate trend for signal; ignore the daily wiggles.
- Glance at “next difficulty” and blocks remaining—helps set expectations for the next two weeks.
- Scan mempool fee buckets; decide urgent vs patient fees in seconds.
- Peek at pool distribution weekly for creeping concentration.
- Note any outlier stale blocks; if they cluster, I get curious.
You’ve got the meanings and the traps. But how do you turn these into actual moves—like deciding what fee to pay today, or how to plan around the next difficulty change? Ready for the simple playbooks I use in real time?
How I use BTC.com Stats for real decisions
Let’s be honest: staring at on-chain charts can feel like watching a heart monitor during a marathon—spikes, dips, and a lot of noise. The trick is to turn that noise into a plan. Here’s exactly how I use BTC.com Stats to make confident moves—trading, mining, building, or just staying one step ahead of congestion.
“In markets, anxiety is a decision tax. Data is the refund.”
For traders: a fast pre-flight checklist
I run this quick scan before placing orders, moving funds, or setting withdrawal expectations.
- Mempool size and fee bands: Check the mempool vsize and the current fee ranges (sats/vB). If the top band is thick and the “high priority” fee is spiking, I plan for slower confirmations and pad fees. When we saw the Runes/Ordinals rush around the April 2024 halving, fees hit hundreds of sats/vB for hours—BTC.com’s fee band visualization made the spike obvious before Twitter did. Bitcoin Optech documented fee surges like this multiple times in 2023–2024, so it’s not a one-off quirk.
- Block interval trend: I glance at the last 144-block average. If it’s creeping past ~11 minutes, the network is running slow relative to target and confirmations will feel sticky until the next retarget.
- Hashrate + difficulty posture: If hashrate has been sliding and BTC.com’s estimated next difficulty change is negative, I expect relief after the retarget (faster blocks). If it’s positive and big, fees can cool as blocks come faster—use that to time larger on-chain moves.
- Latest blocks and transactions per block: Empty-ish blocks during high demand can hint at policy/filter quirks or network lag; fat blocks with lots of vbytes but still rising mempool tell me demand is outpacing supply—don’t cheap out on fees if you need speed.
Simple rules I actually use:
- If mempool > 200 vMB and high-priority > 80 sats/vB: I either pay up, use RBF, or wait. No heroics.
- If we’re inside the last ~300 blocks before a big positive difficulty retarget: I queue withdrawals to hit after the change when blocks likely speed up.
- If block interval spikes and ETF/news is driving demand: I assume delays, set alerts, and avoid tight settlement windows. Data beats vibes.
Why this works: Fees are a supply-and-demand meter. When demand surges (NFT-like inscriptions, Runes, big exchange maintenance), the mempool swells and sats/vB jumps. Studies and dashboards from sources like Bitcoin Optech and BitMEX Research have repeatedly shown fee spikes align with sudden bursts of transaction demand—seeing it early is an edge.
For miners: planning around difficulty and fees
I use BTC.com to keep operations rational rather than reactive.
- Retarget window: I watch the “blocks to next difficulty” and the estimated % change. A projected -6% means relief is coming if blocks have been slow; a +6% means get your uptime tight because block intervals should shorten. This matters for cash flow timing.
- Fee share of revenue: On big days (e.g., April 20–21, 2024), fees exceeded 30–40% of miner revenue on several blocks. That’s a green light to postpone non-critical maintenance. If fees are near zero for hours, that’s when I consider brief downtime or firmware updates.
- Hashrate trend vs seasonality: Heat waves and grid events (Texas ERCOT curtailments are a classic example reported by major miners) can knock hashrate and slow blocks. Watching the hashrate chart helps me anticipate the next retarget’s direction—and line up power agreements or strategy accordingly. The Cambridge Bitcoin Electricity Consumption Index has shown how geographically concentrated hashrate can amplify these seasonal effects.
- Pool distribution: I keep an eye on pool shares. Sudden shifts can affect orphan rates and payout smoothness. If my pool’s share drops hard or it misses blocks versus peers, I’ll test a backup pool.
My miner playbook:
- High fee day? Maximize uptime, tighten stale rate, and let your template updates hum.
- Low fee lull + >1,000 blocks until retarget? That’s my maintenance window.
- Projected difficulty drop? Plan next week’s budgets with slightly better margins.
For builders, node runners, and learners
Operations don’t have to be a guessing game. I use BTC.com to pick calm windows and sanity-check my node.
- Maintenance timing: When mempool vsize is thin and fee bands are flat, that’s my sweet spot for reindexing, upgrading, or restarting services. If fees are spiking, I wait—you don’t want to come back to a backlog and angry users.
- Node validation: I compare my node’s latest block height, timestamp, and mempool count with BTC.com. If I’m materially off, I check peers and bandwidth. A mismatch isn’t always a problem, but it’s a strong signal to investigate.
- Teaching moments: I show newcomers the block interval chart and then the difficulty schedule. Seeing 2016-block epochs alongside random block arrival times makes the “not every 10 minutes” idea click instantly.
Reality check: Short-term hashrate wiggles are noisy. Longer windows stabilize the picture. That balance—spot checks for operations, trend views for planning—keeps me from overreacting.
What to watch daily vs weekly
Daily (60–120 seconds):
- Mempool size and fee bands (sats/vB)
- Recent block interval and next-block fee estimate
- Latest blocks: coinbase fees, tx count per block
Weekly (10 minutes):
- Hashrate moving average and direction
- Estimated difficulty change and time to retarget
- Pool share shifts and any spike in orphan/stale blocks
Example cadence I actually follow: I skim BTC.com every morning before market hours for fee pressure and block rhythm, and do a deeper weekly review on Sundays—hashrate trend, difficulty posture, and pool distribution. It’s calm and it works.
Want to go from “scan” to “system”? In the next part, I’ll show how I use BTC.com’s historical charts, grab clean exports, and cross-check with a couple of smart tools—plus a 30‑second way to save a shareable snapshot for your notes. Ready to make your workflow bulletproof?
Power features, exports, and smart comparisons
Once you’re comfortable with the main tiles, this is where BTC.com really earns a bookmark. Here’s how I stretch the stats page for deeper research, cleaner references, and fewer wrong calls.
Historical charts and trends
Short windows are noisy. The moment I need signal, I switch to longer timeframes and smooth the view. My usual flow:
- Zoom out to 90D, 1Y, or All for hashrate, block interval, and mempool size. If a “spike” disappears on a 7–30 day smoothing, it was probably noise.
- Think in 2016-block epochs (difficulty retarget windows). When I study block intervals, I mark retarget boundaries to see how miners and the protocol “caught up.”
- Use log scale for hashrate when you want to see percentage growth across cycles. Linear is great for absolute swings; log is better for structure.
What this looks like in the real world:
- China’s mining exodus (mid‑2021): On a 1Y hashrate view, you’ll spot the sharp drawdown after China’s crackdown followed by a steady recovery. Block intervals widened during the drop, then normalized after a series of retargets. That pattern is textbook “structural change,” not a blip.
- Ordinals/BRC‑20 fee waves (May 2023, late 2023, early 2024): Stretch mempool size and fee rate charts to 180D–1Y and you’ll see the congestion pulses that pushed fee floors into the hundreds of sats/vB. Notice how the mempool didn’t clear instantly—use that memory the next time fees start ramping.
- Halving week (April 2024): On a 30–90D window, you’ll see the post‑halving fee spikes—some early blocks earned tens of BTC in fees—followed by a re‑balancing as activity cooled. If you overreacted on a 1D chart, you’d have missed that it normalized quickly.
Quick test I use: If a pattern vanishes when I switch from a 1D to a 7D average, I label it “situational” and don’t pivot strategy around it.
One more practical angle: when comparing fee environments across time, focus on percentile bands (e.g., the 25th–75th percentile sats/vB) if available. Median fees alone can be skewed by outliers during inscription or exchange burst traffic.
Exports, links, and APIs
Good research needs receipts. BTC.com makes it easy to keep a clean trail.
- Shareable chart links: Most charts encode the timeframe in the URL. When I spot something interesting, I copy the link and paste it into my notes with a timestamp and one‑line take. If the chart supports it, I’ll also hit “save image” for a quick snapshot.
- API for structured data: Need blocks, mempool size, pool shares, or difficulty windows in JSON? BTC.com exposes public endpoints documented from their API link (you’ll usually find it in the footer or docs pages). I keep a tiny script that pings:
- latest blocks for block interval checks
- mempool metrics for fee pressure alerts
- pool attributions for centralization watchlists
Then I log daily snapshots to a CSV so I can chart my own 7–30 day averages without eyeballing. - Reference discipline: My template in a research note:
- Link: paste the exact BTC.com stats URL with the timeframe
- What I saw: one sentence (e.g., “Mempool >200M vB for 48h; 50–80 sats/vB to confirm in 1–3 blocks”)
- Screenshot: optional, but handy when you want to compare same‑day views across sites
Small but mighty tip: if you’re running a spreadsheet or a notebook, label observations by retarget epoch (e.g., “Epoch 413”) instead of calendar week. Bitcoin’s clock is 2016 blocks; your notes will line up cleaner.
Cross-checking with alternatives
One explorer is good. Two (or three) is safer—especially during volatility. Here’s when I compare and why:
- Mempool size and fee bands: I cross-check BTC.com with a mempool-first tracker (e.g., real-time fee histograms). Expect small deltas—each site has its own node, policy, and tx visualization. If the fee floor diverges by more than a bracket (say 10–20 sats/vB) for hours, I get a second opinion before acting.
- Pool distribution: Pool attribution uses coinbase tags and heuristics. I compare BTC.com’s pool map with at least one other source to rule out misattribution. A sudden jump from “Unknown” to “Pool X” on one site doesn’t always mean miners switched; sometimes it’s a labeling catch‑up.
- Difficulty projections: I like to sanity‑check the next-retarget estimate. If BTC.com shows +3% and another source shows +7%, I look at the current average block interval and the remaining blocks in the epoch. Big gaps early in an epoch are normal; they should converge as you get closer to the retarget.
Beat confirmation bias: Before you check a second source, write your hypothesis in one line: “I think fees will normalize within 24h.” Then see if multiple datasets support it. If not, adjust. No attachment, no drama.
How I resolve conflicts quickly:
- Time alignment: Make sure both charts are on the same window (UTC, last 24h vs last 48h, etc.). Misaligned axes create fake disagreements.
- Method check: Fee “median” vs “25th–75th percentile” can tell different stories. Same metric, same method, or it’s apples and oranges.
- Node policy differences: Mempool acceptance differs by policy (RBF, minimum relay). If you want a single source of truth, run your own node and compare what you see locally to any explorer’s numbers.
Helpful reads and tools to go deeper
If you want to go beyond the essentials, here’s a curated list I recommend exploring:
Want me to show you how I sanity-check BTC.com’s update cadence, or why two sites can show different mempool sizes at the same time? That’s exactly what I answer next—plus the fastest way to export or share data without paying a cent. Ready for the FAQ?
FAQ + quick fixes: the questions people actually ask about BTC.com Stats
Is BTC.com Stats accurate and how often is it updated?
Short answer: yes, for the things that come straight from the Bitcoin blockchain (latest blocks, heights, timestamps, pool tags, raw mempool counts). BTC.com runs full nodes and surfaces that data quickly. You’ll usually see:
- Blocks and mempool: near real-time, refreshed in seconds.
- Fee estimates: refreshed often, but still estimates based on current backlog and recent confirmations.
- Hashrate: always an estimate, inferred from recent block intervals—use 7d or longer averages to avoid noise.
- Difficulty estimate: updated block-by-block during the retarget window; the actual change locks in at the next adjustment (~2016 blocks).
Short-term blips can happen during reorgs, stale/orphan blocks, or temporary node latency. That’s normal across all explorers.
Quick fix: If a number looks odd, refresh once, then cross-check block height with a second source (e.g., mempool.space). If heights match, you’re good. For hashrate and difficulty, judge on multi-day trends, not minutes.
What’s the difference between BTC.com stats and mempool-focused sites?
BTC.com gives you a broad network view—hashrate, difficulty, pool share, recent blocks, and high-level mempool stats. Mempool-focused tools zoom in on fee pressure with granular histograms, live queues, and next-block fee bands.
- Use BTC.com when you want the mining picture (pool distribution, stale blocks, retarget progress) plus a clean read on recent block production.
- Use a mempool-first site (e.g., mempool.space or Johoe’s mempool) when you need precise fee selection and timing for your next transaction.
Quick fix: Keep BTC.com’s stats page open for network health, and a mempool histogram side-by-side for fee decisions. The combo removes guesswork.
Can I export or share data? Is it free to use?
Browsing is free. Most pages have shareable URLs (copy the address bar after selecting your timeframe or view). Some explorers offer APIs for blocks, transactions, and pool data—BTC.com has historically provided developer endpoints with rate limits.
- Sharing: copy the chart/page URL after you set the timeframe; your settings are usually embedded.
- APIs: look for “API” or “Developers” in the site footer or help section. You’ll likely need an API key for heavier use.
- Manual exports: if there’s no CSV button, a quick workaround is saving the page (or using your browser’s “Print to PDF”) and keeping a reference link in your notes.
Quick fix: For repeat research, save a set of bookmarked URLs (e.g., hashrate 180d, mempool 7d, pool share 30d). It’s faster than reconfiguring charts each time.
How do I read hashrate and difficulty without getting fooled?
Think in weeks, not hours. Hashrate is a statistical estimate that bounces around with luck. Difficulty only changes at retarget—about every 2016 blocks (~2 weeks).
- Use 7d or 30d averages for hashrate to spot genuine shifts.
- Watch the retarget window: if the estimated change is swinging wildly early in the period, wait. Signals stabilize as you approach the last 200–300 blocks.
- Context matters: price rallies tend to pull hashrate up with a lag; energy seasonality can shift regional hashrate; policy shocks can move miners fast (2021’s China crackdown cut hashrate roughly in half; difficulty fell a record 27.9% at one adjustment).
Want a neutral reference? The Cambridge Bitcoin Electricity Consumption Index tracks broad hashrate trends and geography over time: ccaf.io/cbeci.
Quick fix: Set a mental threshold: only change plans if the estimated difficulty adjustment is ≥ ±5% with fewer than ~300 blocks left in the epoch. Otherwise, it’s noise.
Why do fee rates spike sometimes? What does mempool size really mean?
Fees are a market. When demand for block space outruns supply, the mempool backlog grows and users bid higher. Spikes can come from:
- Usage waves: exchange consolidation, airdrops, or retail mania during price breakouts.
- New protocols: inscriptions/ordinals or token events (e.g., the Runes launch around the April 2024 halving massively boosted fees; the halving block collected tens of BTC in fees alone).
- Slow block production: unlucky streaks or a hashrate dip briefly reduce throughput, pushing fees up until luck turns.
Mempool size is the total unconfirmed data waiting in bytes (or vbytes), not just transaction count. Fee rate is priced in sats/vB; bigger transactions cost more at the same fee rate. Confirmation time = how your bid stacks up against the current queue.
- Need speed? Choose the “next block” band, and enable RBF so you can bump later if needed.
- Can wait? Pick a slower band. Watch the histogram; when a lull appears, rebroadcast or bump modestly.
- Lower costs long-term: use SegWit/bech32, batch sends, and consolidate UTXOs during quiet periods.
Quick fix: If the mempool is huge (e.g., hundreds of MB) and “next block” is >50–100 sats/vB, assume delays unless you pay up. Use RBF or plan for a multi-block wait.
When BTC.com isn’t enough: what else should I check?
- Mempool detail: mempool.space or Johoe’s queue for granular fee tiers and timing.
- Mining pool share cross-check: miningpoolstats.stream/bitcoin.
- Node/network view: bitnodes.io for reachable node counts and geography.
- Broader context: Bitcoin Optech for high-signal weekly notes on fees, policy changes, and mempool behavior.
Quick fix: Cross-check two independent sources during high volatility. If both agree on height, fee bands, and estimated difficulty, you can act with more confidence.
Wrap-up and next steps
You’re set. Keep a small toolkit:
- Daily: mempool and fees, latest blocks.
- Weekly: hashrate 7d/30d, difficulty estimate, pool share shifts.
Bookmark your favorite views on BTC.com Stats, pair them with a mempool histogram, and ignore noise that lasts less than a few days.
Got a question I didn’t answer? Drop it here and I’ll add it: cryptolinks.com/news.