Top Results ({{ results }})
There are no results

Welcome to Cryptolinks.com – Your Ultimate Crypto Companion! Ready to dive into the world of Bitcoin, blockchain, and cryptocurrency? Look no further than Cryptolinks.com, your one-stop destination for curated crypto goodness. As someone who's spent years exploring the vast crypto landscape, I've handpicked the crème de la crème of resources just for you. Say goodbye to sifting through haystacks of information. Whether you're a curious beginner or a seasoned pro, my personally vetted links cover everything you need to know. I've walked the path myself and selected the most insightful sites that helped me grasp the complexities of crypto. Join me on this journey of discovery. So go ahead, bookmark Cryptolinks.com, and let's conquer the crypto realm together!

ETH/USD: 3068.78
BTC/USD: 64171.46
LTC/USD: 81.36
Cryptolinks - 3800+ Best Cryptocurrency Websites & Bitcoin Sites List of 2024!

by Nate Urbas

Crypto Trader, Bitcoin Miner, Holder. 🚀🌑

review-photo

Outputs per day

outputs.today

(0 reviews)
(0 reviews)
Site Rank: 178

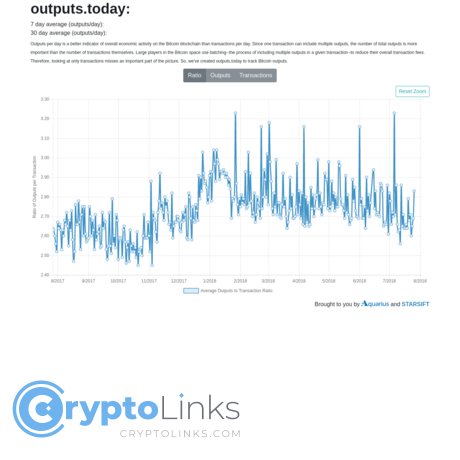
Outputs per day is an indicator of economic activity in the Bitcoin network. Instead of following transactions per day, it tracks the total number of outputs of the Bitcoin network. This is because one transaction can include multiple outputs. A lot of big players in the market tend to bundle their outputs into larger batches to cut down on transaction fees. Therefore, this website tracks the total number of outputs for a more accurate economic indicator.

The website consists of three main graphs which are average outputs per transaction, average outputs per block, and average transactions per block. Each graph is easy to read with historical data back to 2017. It also allows changing of the time frame to get a better understanding of certain periods.

This is a useful tool to spot trends in Bitcoin usage. For example, it is quite clear that there is a drop off of output volume at the start of 2018.

Pros & Cons
  • A better indicator of Bitcoin network usage as it shows all outputs which ignore bundled batch transactions by big Bitcoin traders.
  • Easy to use graphs which can be used to visualize trends.
  • Users are able to adapt timeframes
  • Historical data only dates back to 2017 so it is difficult to get an overall picture of how output per day has really changed.
  • The website only shows three metrics. No ability to compare with other statistics or superimpose the three metrics.