Bitcoin Drops 7% in 24 Hours on Tariff Panic — Is This a Healthy Shakeout or the Start of a Bigger Reset for Crypto’s $3T Comeback?
Is this just a quick “flush and bounce”… or the kind of scary headline that quietly turns into weeks of grind-down pain?
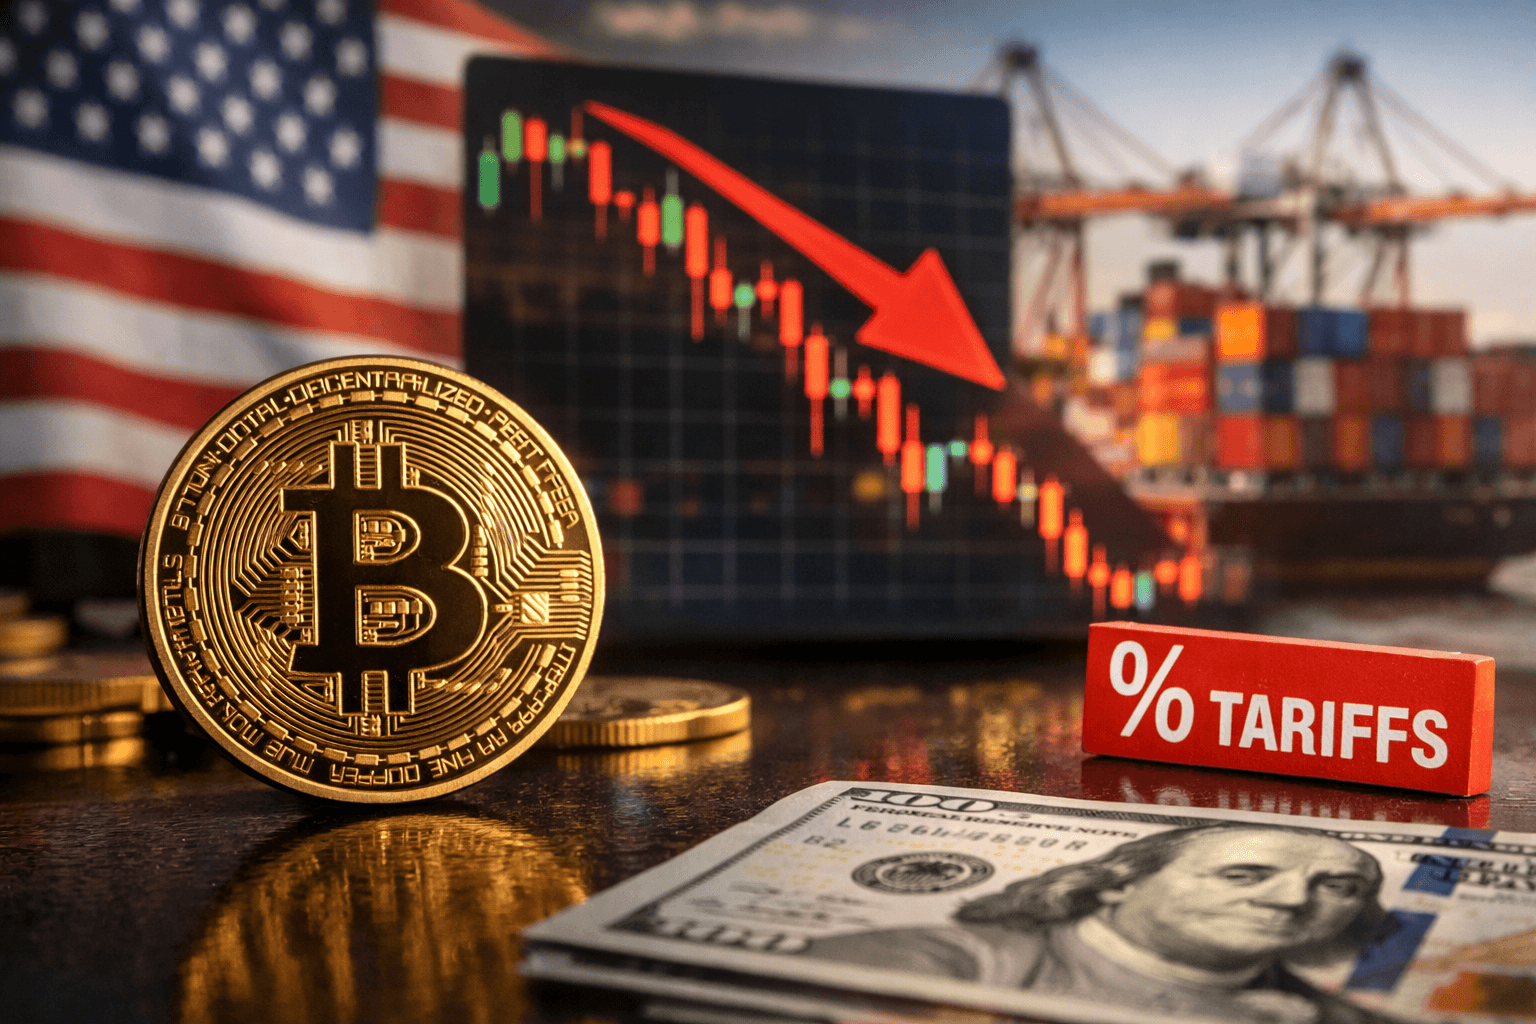
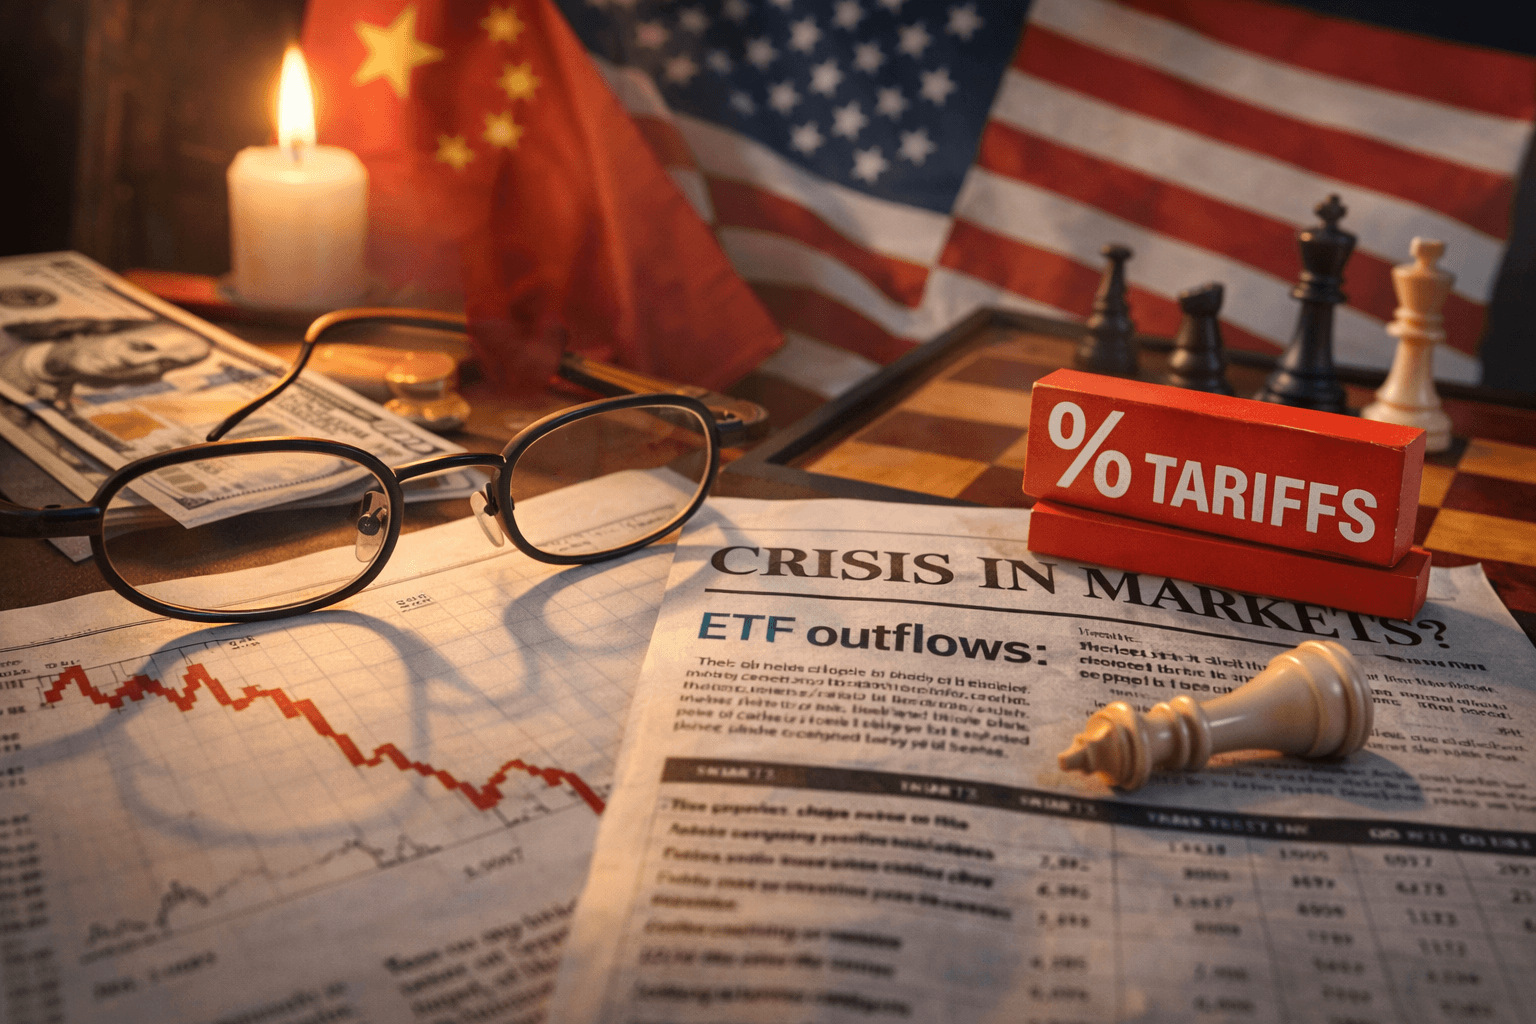
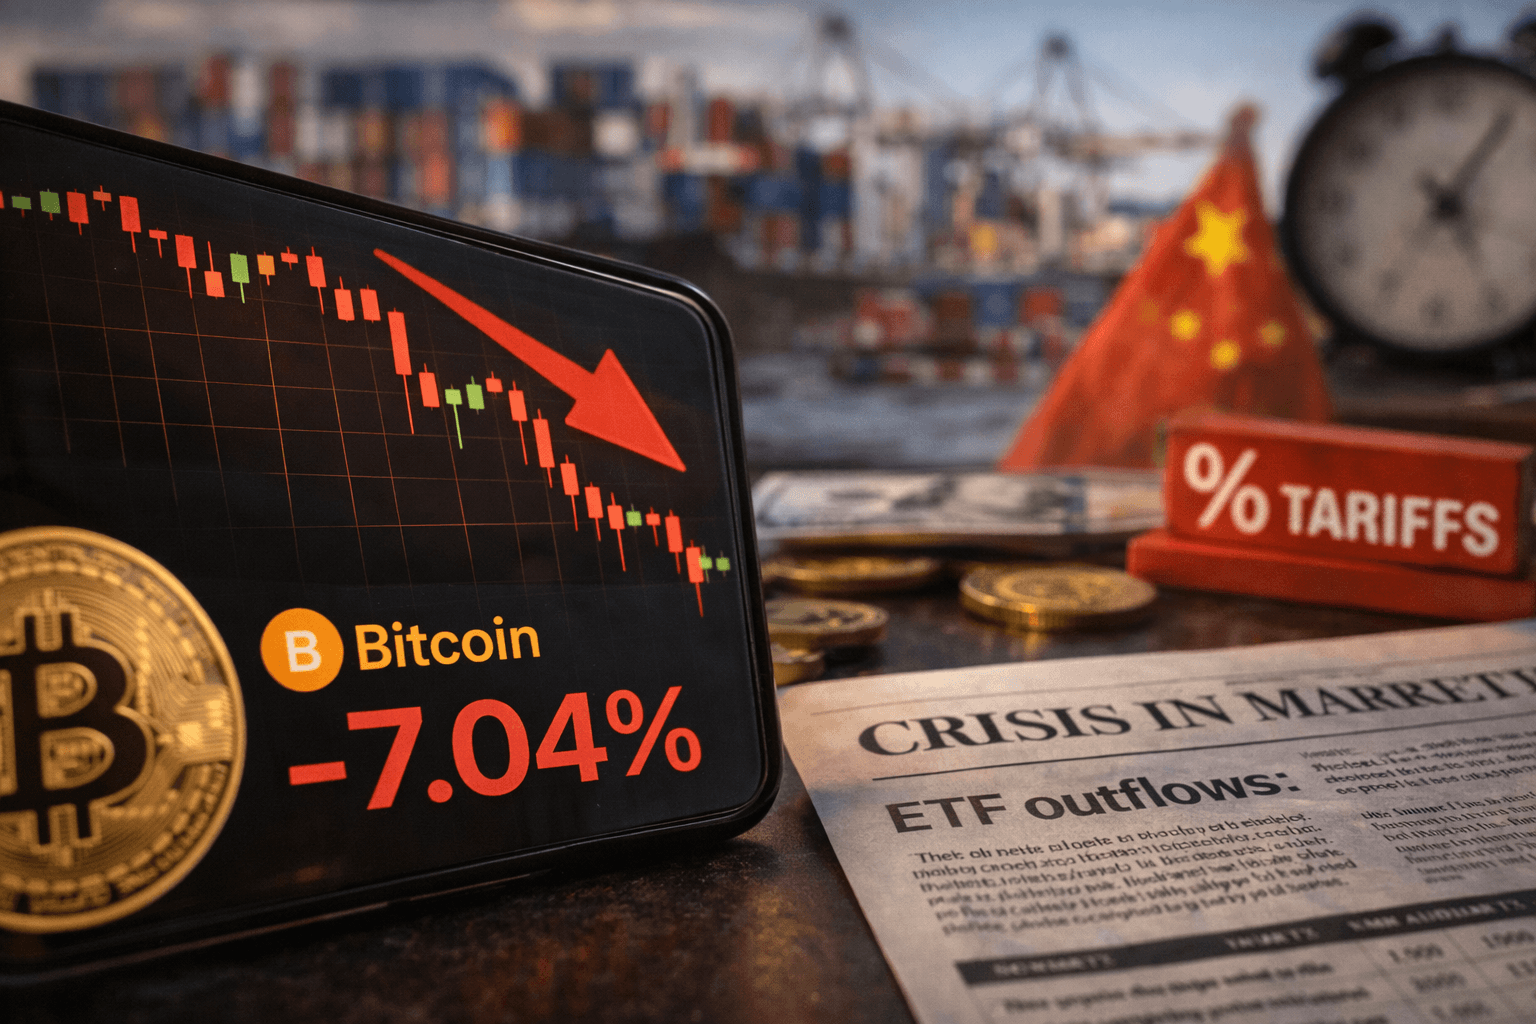
As of today, 31 January 2026, Bitcoin just slid roughly 7% in a single day. And no, this doesn’t feel like a random crypto tantrum. The timing lines up with a nasty mix: tariff fears, geopolitical stress, and ETF outflows all hitting risk markets at the same time.
If you’re holding BTC, ETH, or anything tied to the “crypto is clawing back to a ~$3T total market cap” comeback story, today isn’t the day for vibes. It’s the day to get a clean read on what actually moves price when panic hits.
Listen to this article:
Or read on
The pain right now: tariffs, geopolitics, and ETF outflows can turn a normal dip into a confidence problem
Here’s what makes this drop feel heavier than a normal red candle: it’s not just selling—it’s selling with a narrative. And narratives change behavior fast.
Why “tariff talk” matters to crypto (even though Bitcoin isn’t shipped in containers)
People hear “tariffs” and think “trade war” and “higher prices.” Markets hear something more specific:
- Risk-off mood → investors cut exposure to speculative assets first (crypto is still treated like high-beta risk in fast panics).
- A stronger dollar (often) → a strong USD can tighten financial conditions and make global liquidity feel scarcer.
- Stickier inflation risk → if tariffs push prices up, central banks can stay tighter longer, and that’s usually not great for “easy money” trades.
Even if Bitcoin has nothing to do with imports/exports, the pricing mechanism still runs through liquidity, positioning, and how nervous big portfolios feel. When headlines imply “costs up, growth down, policy tight,” money typically moves into safer corners and away from volatile bets.
There’s also research showing crypto’s “safe haven” story is inconsistent during sudden stress. For example, studies like Conlon & McGee (2020) found Bitcoin didn’t reliably protect portfolios in sharp equity drawdowns (it often behaved like a risk asset when things got ugly fast). Other work, like Bouri et al. (2017), shows “safe haven” behavior can appear in some regimes—but it’s not something you can blindly count on in headline shock windows.
What makes this drop feel different: speed + sentiment shift + ETF mechanics
A 7% move isn’t unheard of in crypto, but the speed matters. Fast drops change trader behavior because they:
- trigger stop-loss clusters, then force repositioning
- hit leveraged longs before they can adjust
- flip the social mood from “buy the dip” to “what if this is the top?”
Now add the modern accelerant: ETFs. When spot Bitcoin ETFs see outflows, you can get a very unromantic type of pressure: steady, mechanical selling that can amplify a move that already started from macro fear.
That’s why today’s candle isn’t just “BTC being BTC.” It’s also a reminder that crypto is now wired into traditional flow dynamics. That’s great on the way up. On days like today, it can feel like the floor gets slippery.
The stakes: a ~$3T market cap recovery can stall fast if BTC loses the room
Crypto has been trying to rebuild confidence around a ~$3 trillion total market cap. In that kind of recovery, Bitcoin is the emotional index—when BTC drops hard, it can:
- freeze altcoin liquidity (people stop bidding the “fun stuff”)
- push traders into cash/stables and “wait mode”
- shift the conversation from “rotation” to “risk management”
In plain English: sharp BTC drops don’t just hurt price—they hurt belief. And belief is what keeps the comeback trade alive.
What I’m going to answer (so you’re not panic-refreshing charts all night)
In the rest of this breakdown, I’m going to keep it practical and data-driven. I’ll show you:
- what likely caused the dump (and why it hit so hard in just 24 hours)
- what data actually matters right now (think: ETF flows, liquidity feel, key levels, leverage signals, dominance)
- how I’m thinking about positioning without panic-selling into the worst part of the candle
If you’ve been around long enough, you already know the trick isn’t “predicting the bottom.” It’s avoiding the classic mistakes that turn a dip into a personal disaster.
Quick reality check: this isn’t 1929, but crashes rhyme for one reason—forced selling
Whenever markets get violent, people start asking variations of: “Is this the big one?” The useful lesson from the October 1929 type of history isn’t the headline—it’s the mechanism.
Markets don’t usually break from one scary story. They break when leverage + fear + forced selling collide.
Crypto has its own version of that recipe: liquidation cascades, leveraged positioning getting snapped, and (now) ETF redemptions creating real flow pressure. That’s what I’m watching—not just the red candle itself.
Who this is for (and what you’ll get out of it)
- Long-term holders: how to avoid donating your coins to the market right when fear is loudest.
- Swing traders: the specific signals I want to see before I respect a reversal (and what would make me suspicious of a dead-cat bounce).
- Newer investors: how to tell a normal bull-market pullback from a real trend break—without needing a PhD in candlesticks.
So here’s the real question: was today’s move mostly a macro headline shock… or did it hit a structure problem (flows + leverage) that can keep dragging price even if the news cools off?
Next, I’ll break down the 24-hour dump into the three buckets that actually matter—and show you the exact clues I’m checking before I treat this as a “shakeout” instead of a “reset.”
What likely caused Bitcoin’s 7% drop (and why it hit in 24 hours)
A 7% Bitcoin dump in a single day rarely comes from one “reason.” What usually happens is a stack—three forces hit the market in the same direction, at the same time, and the move accelerates fast.
Here’s how I’m breaking today’s drop down:
- Macro shock: tariff fears + geopolitical stress flip the whole market into “risk-off.”
- Flows: ETFs (and big spot holders) turn that fear into real, steady selling.
- Market structure: thin liquidity + leverage + liquidations turn a slide into a cascade.
The sequence matters. This is the common pattern I see in fast red days:
Headline fear triggers selling → ETF redemptions add constant pressure → market makers pull liquidity → price slips into liquidation zones → forced selling accelerates the move.
When those gears lock together, you don’t get a gentle pullback—you get a 24-hour air pocket.
Tariff fears = “risk-off” pressure (even if crypto has nothing to do with shipping containers)
People love to say “Bitcoin isn’t affected by tariffs,” and on the surface that’s true—no one is putting BTC in a container and paying customs fees.
But tariffs change something crypto does care about: liquidity and financial conditions.
Tariff headlines tend to raise the odds of:
- Inflation surprises (higher input costs can bleed into consumer prices).
- Slower growth (higher costs can reduce demand and margins).
- A more cautious central bank path (rate cuts get delayed, or the market prices fewer cuts).
- A stronger dollar (often happens when global money gets defensive).
That cocktail is usually bad for high-beta assets. And despite the “digital gold” narrative, Bitcoin often behaves like a liquidity thermometer in sudden headline shocks.
There’s actually research that supports this “regime switch” idea. Multiple academic papers have found that crypto correlations and behavior shift depending on stress levels. For example, work by Corbet and co-authors (published across several studies from 2018 onward) shows crypto can trade more independently in calm periods, but correlation patterns can tighten during market stress.
Another angle: the “Bitcoin as digital gold” debate. Studies like Baur, Hong & Lee (2018) questioned whether Bitcoin reliably behaves like gold as a safe haven. My real-world takeaway is simple:
Bitcoin can look like a hedge in slow-motion distrust.
But in fast panic, it often trades like a leveraged risk asset first—and only later finds its “hedge” footing.
So when tariff fear hits, I don’t ask, “Does this directly affect Bitcoin?” I ask, “Does this tighten liquidity and raise fear across markets?” If yes, crypto usually feels it—fast.
Geopolitics and correlations: when stocks flinch, crypto usually flinches harder
Geopolitics is the same story with a sharper edge: uncertainty rises, risk limits get cut, and correlation across assets jumps.
In calmer markets, Bitcoin can trade its own narrative—adoption, halving cycles, ETF demand, on-chain trends. But when macro fear takes over, BTC frequently trades like high-beta tech.
This is what I’m checking in real time when I see a one-day -7%:
- Nasdaq / S&P trend: Are equities trending down or just wobbling?
- Volatility gauges (VIX-style fear): Is fear expanding or fading?
- USD strength: A rising dollar often pressures risk assets.
- Leadership: Is BTC leading the move (crypto-specific panic), or lagging stocks (macro-driven)?
If stocks are only down modestly and BTC is down hard, that’s often structure + leverage making crypto overreact. If stocks are sliding too, then crypto is usually just expressing the same fear—only with more speed.
ETF outflows: the unglamorous engine that can push price around
ETFs are “boring” compared to memes and narratives, but they matter because they can convert sentiment into mechanical, repeatable flow.
When spot Bitcoin ETFs see outflows, the authorized participant/redemption mechanism can translate that into real spot selling (depending on how those redemptions are handled and hedged). Either way, the market feels it as persistent pressure.
Why this matters specifically on a fast red day:
- Outflows don’t care about vibes. If risk committees de-risk, allocations get cut.
- They can last multiple days. Even if panic selling slows, allocations can still unwind.
- They reduce the “bid cushion.” When flows are negative, bounces struggle.
There’s also a well-known body of research on how ETF flows can amplify price impact and volatility in underlying markets. For example, Ben-David, Franzoni & Moussawi (2018) documented how ETF ownership and trading can increase volatility and correlation in underlying securities. Crypto ETFs aren’t identical to equity ETFs, but the key idea carries over: when the wrapper becomes the main highway for capital, flow can become the signal.
So I’m not just looking at “today’s outflow.” I’m looking for the flow shape:
- One-day panic that snaps back quickly, or
- A multi-day outflow streak that keeps leaning on price.
If outflows slow down while price stops making new lows, that’s often when the market starts building an actual base instead of a temporary bounce.
This is where the “why did it happen so fast?” question usually gets answered.
Leverage builds quietly during green weeks. Traders get confident, funding stays positive, open interest creeps up, and everyone thinks they’re being “efficient” with capital.
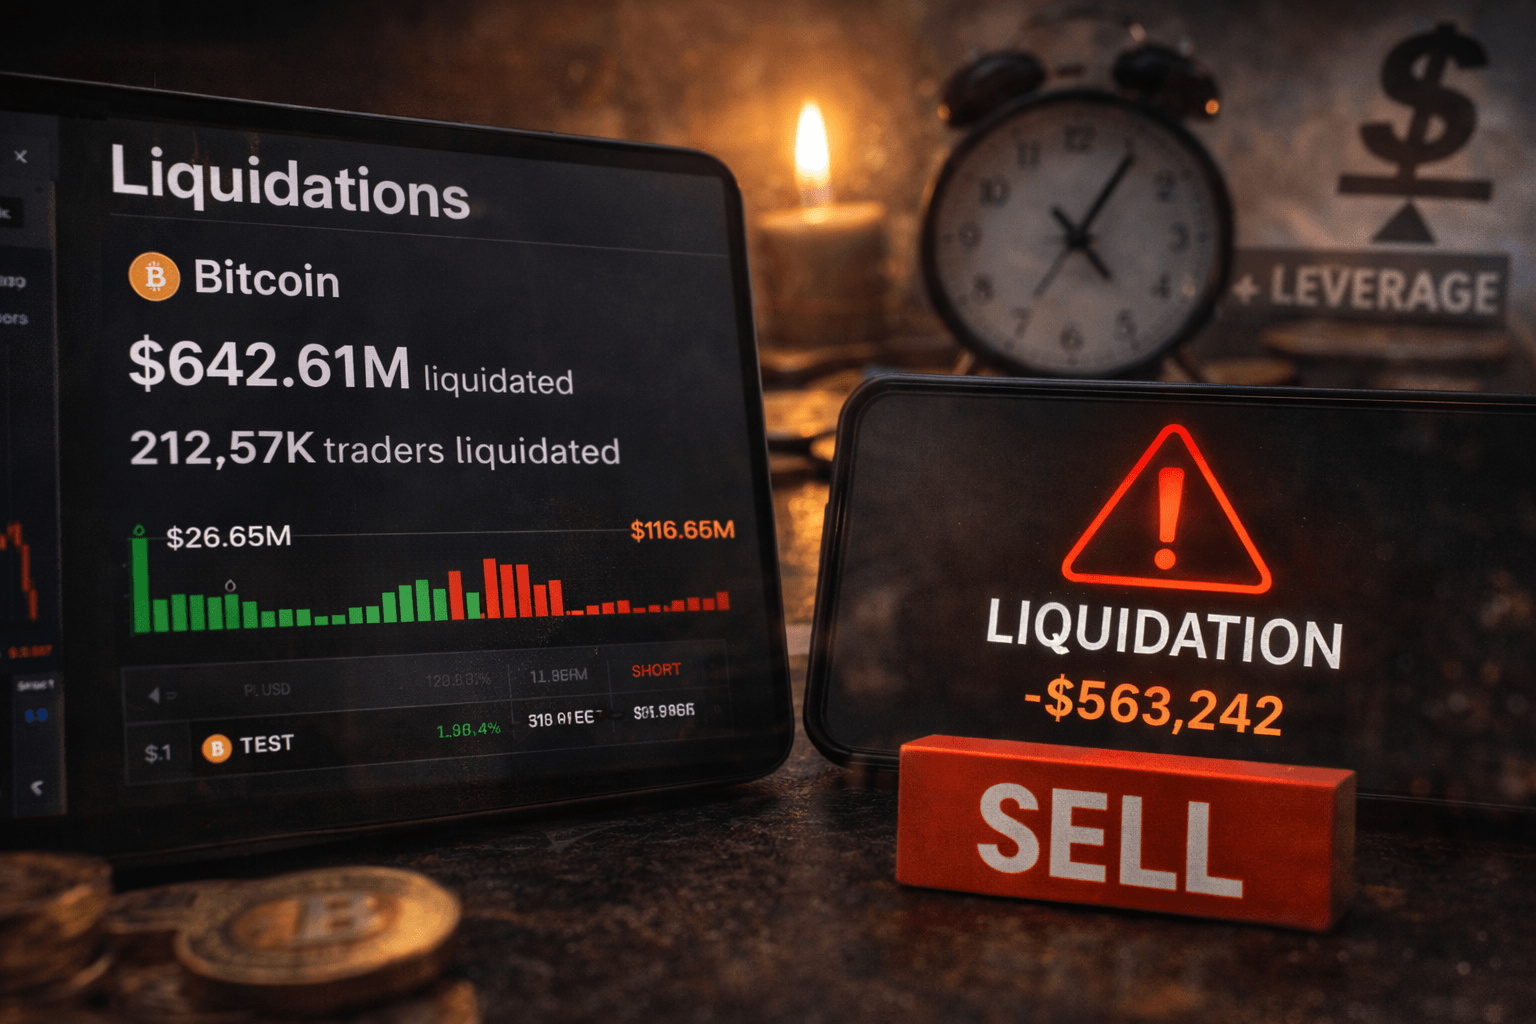
Then a macro headline hits, price drops into a pocket where stop-losses and liquidation thresholds live, and suddenly you get a seller that doesn’t have an opinion:
Liquidations are forced sellers. They sell because they must, not because they want to.
That forced selling is why a move can go from “normal dip” to “straight line down” in hours—especially if liquidity is thin.
Here’s what I watch to tell whether leverage got truly flushed or if danger is still sitting underneath the market:
- Funding rates: Do they cool off or flip negative? A flip often signals longs got punished.
- Open interest (OI): Does OI drop hard (positions wiped) or stay elevated (powder keg)?
- Liquidation spikes: Big liquidation prints often mark the “whoosh” part of the move.
- Reaction after the flush: Does BTC reclaim levels quickly, or does it bounce weak and roll over?
I also pay attention to liquidity fragmentation across venues. Research like Makarov & Schoar (2020) showed crypto markets can experience meaningful price dislocations across exchanges when arbitrage capacity is strained. In plain English: when volatility hits, even “efficient” markets can get sloppy, and that sloppiness makes cascades worse.
The $3T market cap recovery: what breaks it, and what keeps it alive
I’m watching the total crypto market cap like a hawk because it tells me whether this is just BTC volatility—or a broader “recovery story” problem.
The recovery chain usually looks like this:
- BTC health sets the tone and collateral quality.
- ETH liquidity determines whether risk appetite is expanding beyond BTC.
- Alts only truly run when liquidity is plentiful and confidence is stable.
So what actually threatens the recovery?
- BTC down hard and failing to stabilize
- ETH underperforming (risk appetite shrinking)
- Stablecoin liquidity shrinking (less dry powder entering the system)
That’s the combination that tends to turn a quick shakeout into a longer reset.
What’s constructive—even if it still feels ugly in the moment?
- BTC stabilizes after the flush (less forced selling)
- BTC dominance peaks (risk stops bleeding out of the whole complex)
- ETH holds key support (confidence remains)
- Stablecoin supply/flows stop contracting (liquidity returns)
When those pieces line up, the market can rebuild. When they don’t, rallies tend to get sold.
“Are we still in a bull market?”—my simple checklist (so we don’t argue with vibes)
I’m not interested in “bull market” as a feeling. I want a checklist that tells me whether the bigger trend is intact even after a violent day.
Here’s the framework I use:
- Trend structure: Are we still making higher highs / higher lows on higher timeframes (weekly, not 15-minute candles)?
- Breadth: Is participation broadening (more coins holding structure), or is it just BTC doing all the work?
- Liquidity: Are stablecoins growing? Are ETF flows supportive over a multi-week window? Are credit conditions tightening or loosening?
- Sentiment extremes: Does this look like capitulation (forced selling) or complacency cracking?
One point that saves people a lot of money: bull markets often include brutal pullbacks. What matters is not that we dumped—it’s whether the market prints a lower low and fails to recover. That’s when the character changes.
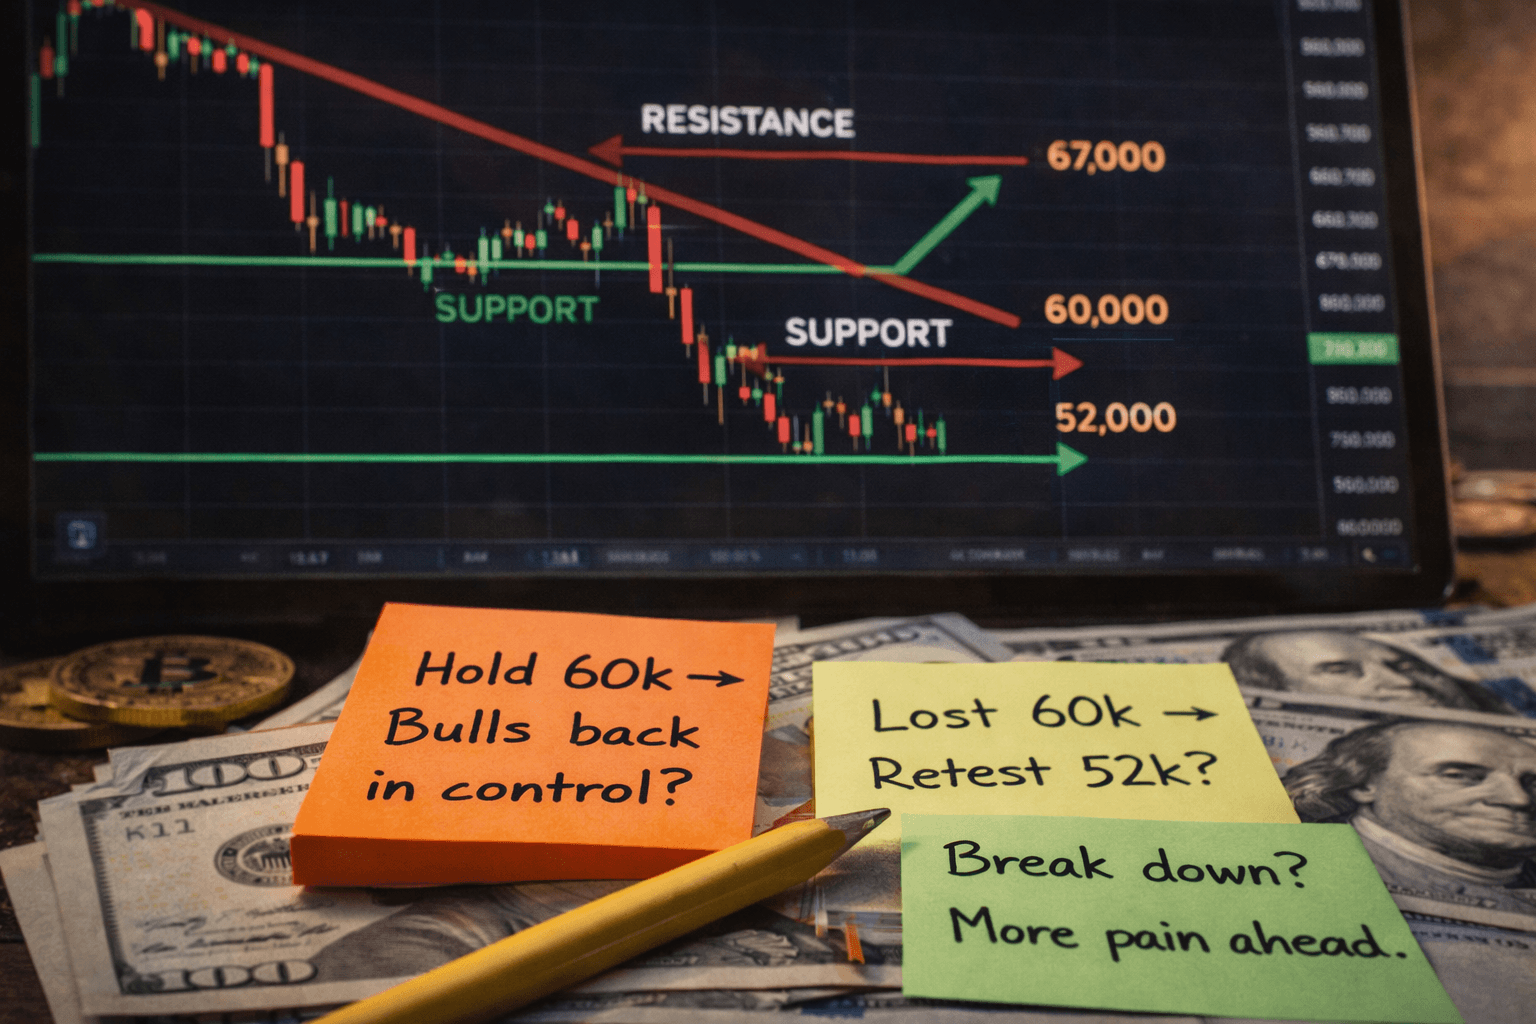
My “line in the sand” levels and scenarios (no predictions, just if/then)
I’m not going to pretend I know the exact next candle. What I can do is plan reactions in advance so I don’t trade emotionally.
This is how I’m framing it:
Scenario A: Healthy pullback
- BTC holds a key support zone (the one the market has defended recently)
- Funding cools off and stays reasonable
- ETF outflows stabilize (even if they don’t flip positive yet)
- Result: chop, grind, then a recovery attempt
Scenario B: Bigger reset
- Support breaks cleanly
- Rebounds get sold quickly (lower highs start stacking)
- Outflows persist across multiple sessions
- Result: deeper leg down and a slower rebuild for the broader market cap recovery
Scenario C: Surprise bounce
- Macro headline pressure cools fast
- Flows reverse (or outflows sharply slow)
- Shorts pile in late and get squeezed
- Result: fast recovery candle that feels “unfair” if you panic-sold
The point is simple: when you define the if/then in advance, you stop letting a red chart bully you into bad decisions.
What I’m watching right now (market chatter + charts I’m checking)
I like to scan smart market chatter because it highlights what people think is happening—then I cross-check it against hard data (price structure, flows, leverage).
These threads are worth reading for context and current narratives:
- https://x.com/0xFlomo/status/2017092374464516527
- https://x.com/JrSydrick/status/2016941904634548391
- https://x.com/NextGenCrypto37/status/2017259514299363804
- https://x.com/DOGEai_tx/status/2016902029348581752
- https://x.com/notanotherquant/status/2017242320605692185
- https://x.com/cryptocore70/status/2017271499305173251
- https://x.com/Crypto_InvestSH/status/2017046720224567628
- https://x.com/InvestorNumber6/status/2016730169411621326
- https://x.com/CoinSageX/status/2017001838655242724
As I read those, I’m asking two questions:
- Which narrative explains the move? (tariffs, geopolitics, flows, leverage)
- Which data confirms it? (ETF flow trend, OI/funding behavior, reclaim vs rejection of levels)
Chatter is useful. But I only trust it after price and flows agree.
Now the real question—the one that decides whether today was an opportunity or a warning shot:
If you’re holding BTC, ETH, or alts right now… what should you actually do with your positions after a 7% day? In the next section, I’ll lay out exactly how I’m handling it based on risk profile—without panic-selling, without revenge trading, and without pretending I can pick the exact bottom.
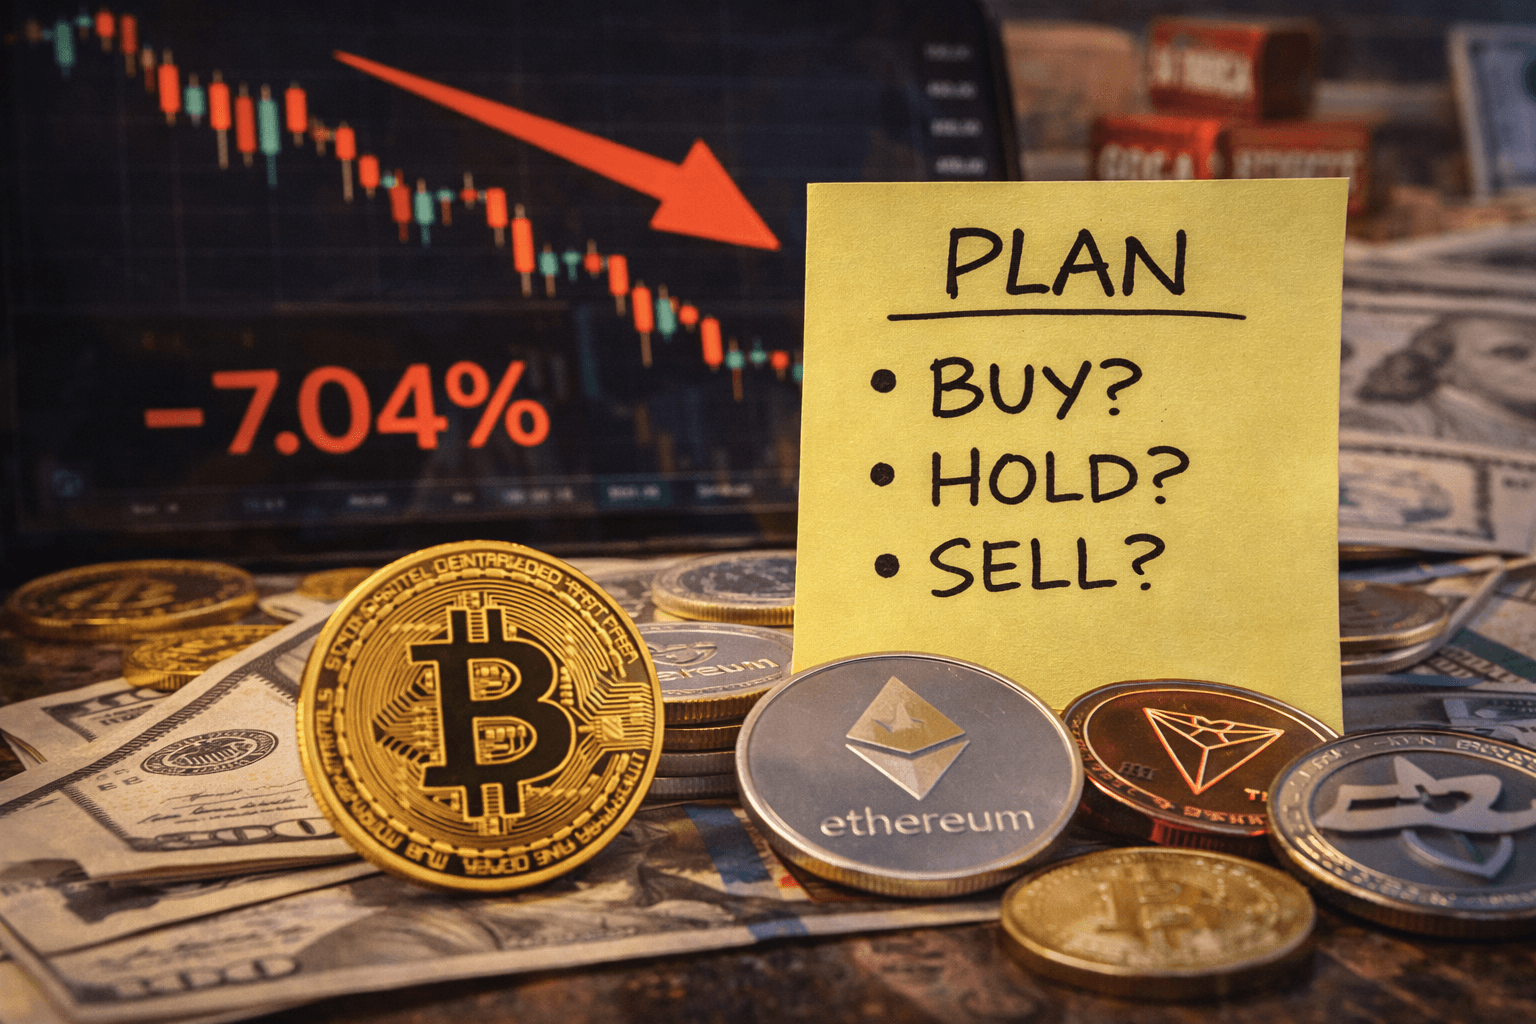
What this means for your holdings: how I’m handling BTC, ETH, and alts after a 7% dump
A 7% Bitcoin drop in 24 hours is the kind of day that makes smart people do dumb things.
So my goal right now isn’t to “nail the bottom.” It’s to avoid the big three mistakes that blow up good portfolios:
- Panic-selling into the strongest part of the fear
- Revenge trading (trying to “win it back” with oversized risk)
- Doubling down blindly just because price is lower
Here’s how I’m approaching BTC, ETH, and alts depending on what kind of investor you are.
If you’re a long-term holder: protect your thesis, not your ego
If your plan was “hold through volatility,” then a single ugly day is not your signal to improvise. The move here is to separate thesis damage from ego damage.
What I consider “noise” (painful, but normal):
- Fast drawdowns during headline weeks
- Shaky sentiment and people flipping narratives overnight
- Short-term underperformance in ETH/alts while BTC dominance rises
What would make me treat this as more than noise:
- A sustained shift where every bounce gets sold for weeks (not days)
- Liquidity staying tight long enough that risk appetite doesn’t come back
- Market structure degrading across the board (BTC can’t stabilize, ETH can’t hold key zones, and alts lose floors in sequence)
Practically, my long-term playbook looks like this:
- Position sizing check: If one coin quietly became “the whole portfolio,” I trim back to a level I can actually hold through red weeks without flinching.
- Staged buying, not all-in buys: I prefer 3–5 smaller entries over time rather than one dramatic click. If we get follow-through downside, I’m not instantly underwater on the entire add.
- No leverage for long-term bags: Leverage turns volatility into a liquidation schedule. If I want more exposure, I do it with spot and time.
- Keep dry powder: Cash (or a stablecoin allocation you trust) isn’t “missing out.” It’s optionality.
- Rebalance with rules, not feelings: If BTC held up better than alts and my risk drifted, I rebalance back to target weights instead of “punishing” the red positions emotionally.
One quick mindset anchor that’s actually backed by research: people tend to make the worst decisions under stress because losses feel heavier than gains. Behavioral finance has shown this for decades (loss aversion from Kahneman & Tversky’s work). Translation: on days like today, your brain will beg you to hit the sell button for emotional relief, not because it’s the best move.
And one more: frequent trading usually hurts returns for the average person. The classic Barber & Odean research (“Trading Is Hazardous to Your Wealth”) found that overactive traders tend to underperform because they pay the volatility tax in the form of bad timing and overconfidence.
So if you’re truly long-term, the win is simple: make fewer mistakes than the crowd.
If you trade: wait for confirmation instead of trying to be a hero
If you’re trading this, respect the environment: headline-driven volatility is where “pretty setups” fail the most.
I’m not interested in guessing. I’m interested in confirmation. Before I size up, I want to see a few things line up:
- Reclaimed levels that actually hold: Not a one-hour pop—something that holds through at least a couple of sessions without instantly giving back.
- Volume that supports the move: A weak bounce on thin volume is often just a pause before another leg down.
- Pressure easing in the plumbing: I want to see signs that the forced-selling wave is done (things like liquidation intensity cooling and derivatives froth resetting).
- Flows calming down: If the big flow drivers are still leaning one direction, I trade smaller and faster.
My risk controls get tighter in weeks like this:
- Smaller size than normal: If volatility doubles, my position size should shrink—not stay the same.
- Hard invalidation points: I define the “I’m wrong” level before I enter. No negotiating with myself mid-trade.
- No “make it back” trades: If I take a loss, the next trade gets smaller, not bigger. That one rule has saved me more money than any indicator.
For quick tools I keep open on days like this:
- CoinGlass for liquidations and derivatives conditions
- Farside Investors for a clean read on ETF flow updates
- Glassnode for on-chain and broader market metrics when I want to sanity-check narratives
If you’re an active trader, your edge is survival. You don’t need to catch the first bounce. You need to catch the bounce that doesn’t immediately fail.
If you’re overexposed and stressed: make one clean decision today
If you feel sick watching candles, the problem usually isn’t the chart—it’s sizing.
Here’s the most practical move I know: reduce the position to the point where you can think clearly again.
- Trim to sleep-at-night size: Not because the market “must” go lower, but because stress ruins decision-making.
- Stop checking price every five minutes: It fuels impulsive clicks. Set alerts, not doom-scroll loops.
- Write a one-page plan: What you’ll do if BTC stabilizes, what you’ll do if it breaks lower, and what would make you add risk again.
This isn’t weakness. It’s how you stay in the game long enough to benefit when the market turns back up.
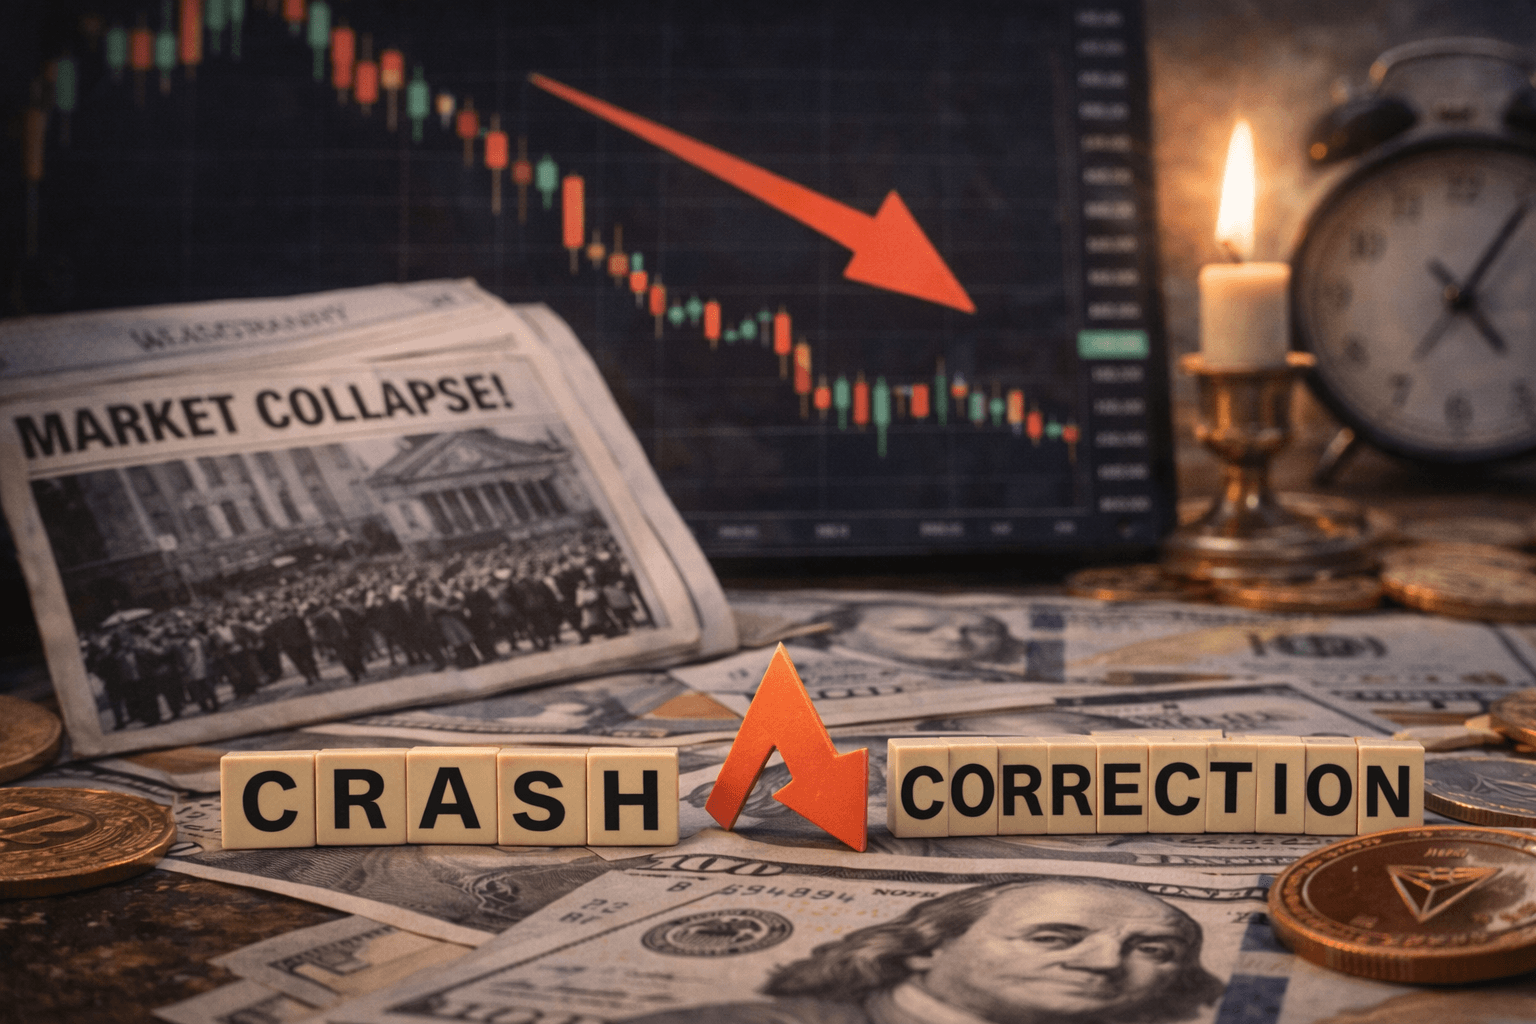
A “crash” vs a “correction”: the 1929 lesson in one sentence
1929 wasn’t “one bad day”—it was a system breaking under leverage, fear, and forced selling, so I’m watching for persistent stress signals, not just an ugly 24-hour candle.
In crypto terms, I care less about today’s headline and more about whether stress becomes self-sustaining: repeated forced-selling waves, tightening credit conditions, and selling that refuses to fade even when price tries to bounce.
My takeaway (and what I’ll update next)
Today’s 7% drop is a warning shot, not an automatic end-of-cycle signal.
My base approach is simple:
- BTC: I’m treating it as the “core health” gauge. If it stabilizes, everything else gets a chance to breathe.
- ETH: I’m watching whether it holds up once the panic selling cools—ETH strength (or weakness) often tells you how much real risk appetite is left.
- Alts: I’m staying selective and smaller until the market proves it can hold support and rotate back into risk instead of selling every bounce.
On Cryptolinks News, my next updates will focus on three things only:
- The ETF flow trend (does selling pressure fade or persist?)
- Key support and reclaim behavior (are we bouncing, or are bounces getting sold?)
- Whether the total market cap stabilizes and gets back on track toward that ~$3T recovery path
Make your plan while the screen is red. That’s when emotions do the most damage—and when a clear checklist is worth more than any prediction.