Bitcoin Re-Tests $60K Support: Is a 30-Day Reset Starting?
Is Bitcoin’s $60K retest just another scary shakeout, or is it the first warning shot of a deeper 30-day reset?
That is the question I am watching today, because BTC is not simply brushing against a clean chart level. It is testing confidence at a time when more than $600B has already been wiped from the broader crypto market in recent weeks.
When Bitcoin scrapes the $60,000 area, traders do not all react the same way. Some see a discount. Some see danger. Some see liquidity. Some see a reason to reduce risk before the market gets uglier.
I do not treat one wick below $60K as the whole story. A fast dip and reclaim can mean something very different from Bitcoin spending several sessions below $60K and turning that level into resistance.
So I want to keep this clean: $60K matters, but confirmation matters more.

The Problem: $60K Is Not Just a Round Number Anymore
Round numbers have always mattered in markets because humans like clean levels. Traders place stops there. Bots react there. News headlines use them. Social media turns them into emotional triggers.
This is not just crypto superstition either. Traditional market research has shown for years that prices often cluster around big round numbers and “barrier” levels. Studies on stock market price barriers and currency order clustering help explain why traders pay attention when a major asset tests a big, memorable number.
Bitcoin makes that behavior even more intense because it trades 24/7, has deep leverage markets, and reacts fast when confidence slips.
At $60K, several groups start making different decisions at the same time:
- Short-term traders watch for a clean breakdown, failed bounce, or quick reclaim.
- Leveraged longs worry about margin pressure and forced liquidation if price drops too far.
- Spot buyers decide whether this is a real dip or a falling knife.
- Long-term holders either stay calm or begin showing signs of distribution.
- Altcoin traders watch BTC because a weak Bitcoin usually hits high-beta crypto assets even harder.
That is why I see $60K as a decision zone, not a magic number.
The real danger is not Bitcoin touching $59,800 for a moment. The danger is when the market stops treating $60K as support and starts treating it as overhead resistance.
If Bitcoin breaks cleanly below $60K and fails to recover, the market may not only lose price support. It may lose patience. Dip buyers wait lower. Leveraged traders cut exposure. Late longs get nervous. Sentiment moves from “normal correction” to “what if this gets worse?” very quickly.
Promise: I’ll Separate Panic From Useful Signals
I am not interested in fear clicks. A red Bitcoin candle is not automatically a disaster, and a support test is not automatically a buy signal.
What matters is the quality of the reaction.
Here are the signals I care about most around this $60K retest:
- Support behavior: Does BTC reclaim $60K quickly, or does it start closing below it?
- Liquidation pressure: Are forced sellers showing up under the market? I track this through tools like Coinglass liquidations.
- Sentiment: Is fear rising in a controlled way, or is the market sliding toward panic? The Crypto Fear & Greed Index is useful here, but I never use it alone.
- Long-term holder behavior: Are experienced holders still sitting tight, or are they starting to sell? Glassnode’s long-term holder supply data helps frame that question.
- Long-term trend context: Is Bitcoin still trading comfortably above major cycle reference levels, or is the structure weakening?
A red candle is information, not an instruction.
My goal is simple: separate emotional noise from signals that actually help explain what could happen over the next 30 days.
Quick Answer: How Much Is $60K In Bitcoin?
Fast answer: if Bitcoin is trading at $60,000, then $60K equals 1 BTC before fees, spreads, slippage, or exchange costs.
The formula is simple:
$60,000 ÷ current BTC price = amount of BTC
Here are a few quick examples:
- If BTC trades at $60,000, then $60K buys about 1.0000 BTC.
- If BTC trades at $58,000, then $60K buys about 1.0345 BTC.
- If BTC trades at $62,000, then $60K buys about 0.9677 BTC.
That is why “$60K in Bitcoin” changes every second. The dollar amount stays fixed, but the BTC amount changes with the live Bitcoin price.
And yes, fees matter. A market order on one exchange may not give you the exact same result as a limit order on another exchange, especially during volatile moves around a level like $60K.
Why This June 5, 2026 Setup Feels Important
This June 5, 2026 setup feels important because Bitcoin is testing $60K after a broad market hit, not during a calm uptrend where every dip gets bought without hesitation.
That difference matters.
When the market has already lost hundreds of billions in value, support tests become more emotional. Traders who were confident two weeks ago may suddenly become defensive. People who planned to buy the dip may wait for “just a little lower.” Leveraged positions that looked safe near $64K or $62K can become uncomfortable fast near $60K.
This is where the next 30 days may be shaped less by one intraday wick and more by whether Bitcoin can reclaim $60K quickly or starts accepting price below it.
The key question is not “Did Bitcoin touch $60K?”
The better question is:
Who is forced to act if Bitcoin stays below $60K?
That is where things can change quickly.
- If short-term traders see failed bounces, they may sell strength instead of buying weakness.
- If leveraged longs get trapped, liquidation pressure can build under the market.
- If spot buyers hesitate, the bid can get thinner than people expect.
- If long-term holders remain calm, the bearish case weakens.
- If long-term holders start selling into weakness, the market has a bigger problem.
So for me, the $60K retest is not about guessing the next candle. It is about watching whether Bitcoin can prove that buyers still control this zone.
If BTC grabs $60K back with steadier demand and calmer leverage, the panic story starts to lose power. If BTC sits below $60K while confidence thins out, the chart gets much more serious.
And that leads to the real pressure point now: if $60K stops holding, where does the market start breaking first?
The Key Bitcoin Levels I Would Watch If $60K Breaks
If Bitcoin breaks below $60K, I would not instantly call it a crash. That is too lazy. The smarter question is this:
Does BTC lose $60K and quickly reclaim it, or does the market start accepting price below it?
That difference matters a lot. A fast move under $60K can simply be a liquidity sweep. But if Bitcoin stays below that level, leveraged longs can get trapped, spot buyers may hesitate, and the next support zones can come into play much faster than people expect.
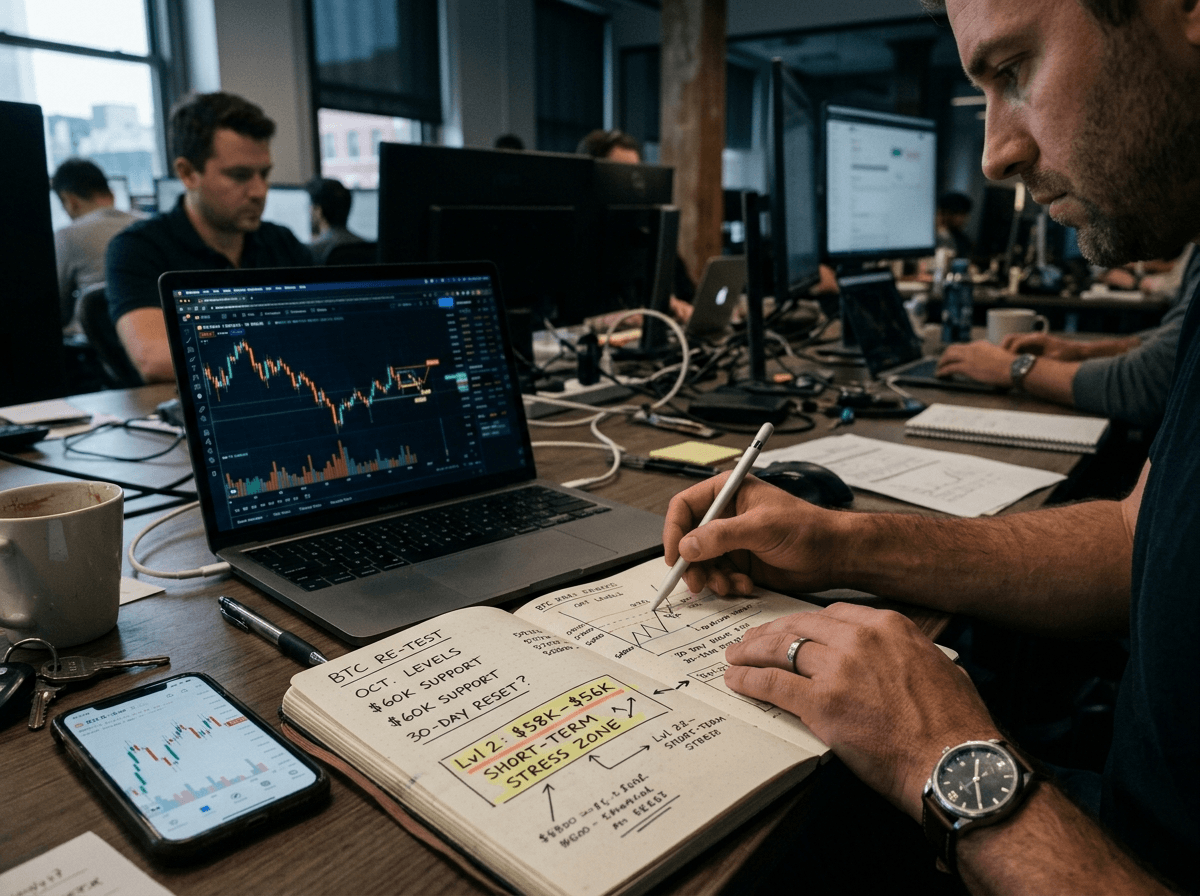
For this June 5, 2026 Bitcoin setup, these are the BTC price zones I would keep on my screen.
- $60K reclaim zone — the first test of whether the breakdown is real or fake.
- $58K–$56K stress zone — where stop-losses and long liquidations can start adding pressure.
- $52K–$50K major risk zone — the area that starts to matter if market structure weakens.
Level 1: $60K Reclaim Zone
The cleanest bullish reaction would be a brief break below $60K, followed by a fast reclaim.
If BTC wicks down to the high $59K area, shakes out late longs, then closes the day back above $60K with stronger volume, I would treat that very differently from a slow, heavy bleed below support.
For me, the reclaim zone is not only about the number. I want to see:
- Daily closes back above $60K, not just a five-minute bounce.
- Less panic in funding rates, because overheated leverage can make every bounce unstable.
- Lower liquidation pressure after the first flush.
- Spot buyers stepping in, not just shorts covering for a quick bounce.
This is where I keep Coinglass liquidations and the BTC-specific liquidation page open. If price dips below $60K but liquidations cool down quickly and buyers absorb the move, that can look like a bear trap.
But if BTC reclaims $60K for a few hours and then loses it again, I would be careful. Failed reclaim attempts often tell me the market is not done testing nerves.
Level 2: $58K–$56K Short-Term Stress Zone
If Bitcoin loses $60K cleanly, the next area I would watch is the $58K–$56K zone.
This is where the chart can start to feel emotional. Traders who bought the $60K support may cut positions. Stop-losses can trigger. Leveraged longs can get forced out. And when that happens, the market is no longer moving only because people choose to sell — it is moving because some traders must sell.
Leverage does not care if your long-term thesis is right. It only cares whether your margin survives the next candle.
A real sample of this kind of behavior showed up in several past Bitcoin drawdowns. In May 2021, BTC lost major support and moved faster than many spot holders expected because leverage was stacked in the wrong direction. In June 2022, forced selling and weak confidence helped push Bitcoin through levels that looked “obvious” only a few days earlier.
That is why I do not look at $58K–$56K as just another chart box. I look at it as a pressure zone.
- If liquidations spike hard but BTC stabilizes, it may be a capitulation pocket.
- If liquidations spike and price keeps sliding, the market may be hunting the next liquidity pool.
- If volume rises but buyers cannot reclaim $60K, I would stay defensive.
The Coinglass BTC liquidation heatmap is useful here because it helps show where leveraged positions may be clustered. I do not treat heatmaps as prophecy, but they can show where price may be pulled if the market starts squeezing overexposed traders.
Level 3: $52K–$50K Major Risk Zone
If Bitcoin cannot recover $60K and sellers stay in control, then the $52K–$50K region becomes the next serious conversation.
This would not feel like normal noise anymore. It would suggest that $60K has shifted from support into resistance, and that is a major change in market psychology.
Here is what would make me take the $52K–$50K risk zone more seriously:
- BTC keeps closing below $60K and every bounce gets sold.
- The $58K–$56K zone fails quickly without strong spot demand.
- Liquidations keep expanding instead of clearing out after one flush.
- Long-term holders begin distributing into weakness.
- Fear rises while price refuses to stabilize.
I have seen a lot of traders make the same mistake at levels like this. They say, “Bitcoin is already down enough.” But the market does not care what feels fair. If buyers do not defend the structure, price can keep searching lower until demand becomes obvious again.
That is why I read Bitcoin price prediction coverage, including pieces like Crypto.news’ coverage on whether BTC could drop to $60K again, as context rather than a trading signal. Headlines can help me understand market attention, but the chart, liquidations, holder behavior, and sentiment must confirm the story.
The Liquidation Risk: What Happens If Longs Get Trapped
Liquidations are one of the biggest reasons a “normal” Bitcoin pullback can turn into a sharp flush.
Here is the simple version.
If too many traders open long positions near $60K using leverage, they do not have much room for error. Once price falls far enough, exchanges automatically close those positions. That forced closing creates sell pressure. That selling can push price lower. Then more longs get liquidated. The move feeds on itself.
This is why I always separate spot selling from forced selling.
- Spot selling is when holders decide to sell BTC.
- Forced selling is when leveraged traders get removed from the market automatically.
Forced selling can make Bitcoin look weaker than the underlying demand really is, at least for a short period. But if forced selling keeps hitting and spot buyers refuse to step in, then the weakness becomes more dangerous.
For this reason, I watch the broad crypto liquidation data on Coinglass, then narrow in on Bitcoin liquidation data. If BTC loses $60K and long liquidations rise sharply, I want to know whether that is a one-time washout or the start of a larger liquidation cascade.
That distinction can make the difference between a tradable shakeout and a deeper reset.

The 200-Week Moving Average: Why Long-Term Traders Still Watch It
The 200-week moving average is one of those Bitcoin indicators that refuses to go away — and for good reason.
It smooths out roughly four years of weekly price action, so many long-term traders use it as a rough cycle filter. I do not treat it as magic. No moving average can protect you from a bad trade. But I do pay attention when Bitcoin moves closer to it, especially during heavy fear.
Historically, BTC trading near the 200-week moving average has often signaled deep stress or long-term value zones. But 2022 also proved something important: Bitcoin can break below it and stay weak longer than bulls want to admit.
That is why I use the 200-week moving average as a context tool, not a blind buy signal.
To track it, I like checking several versions:
- Coinglass 200WMA
- Newhedge Bitcoin 200-week moving average heatmap
- Bitbo’s 200-week moving average chart
- Yahoo Finance coverage of Bitcoin’s 200-week moving average
- Phemex’s 200WMA guide
If BTC breaks $60K but remains far above the 200-week moving average, I would see that as a correction inside a larger trend unless other signals worsen. If BTC starts moving much closer to the 200WMA while long-term holders sell and sentiment collapses, then I would take the downside case more seriously.
Long-Term Holders: Are They Selling Or Sitting Still?
Price tells me what is happening. Long-term holder data helps me understand who may be behind it.
Glassnode generally defines long-term holders as coins held for around 155 days or more. These holders are not perfect. They can panic. They can sell tops. They can misread the market like anyone else. But as a group, they are still one of the most important Bitcoin cohorts to watch during major support tests.
If BTC loses $60K and long-term holder supply stays flat or rises, that softens the bearish case for me. It suggests experienced holders are not rushing for the exits.
But if Bitcoin breaks support and long-term holder net position change turns sharply negative, that is a different message. It means older coins may be moving into the market while price is already weak.
The two Glassnode charts I would watch closely are:
I also like the broader Glassnode BTC long-term holder and short-term holder essentials dashboard, because it helps compare patient holders with newer buyers.
This matters because a break below $60K means something very different depending on who is selling.
- If short-term traders panic but long-term holders sit still, the move may be a shakeout.
- If short-term traders panic and long-term holders start distributing too, the market may need a lower reset.
Sentiment Check: Fear Can Create Opportunity, But It Can Also Get Worse
Fear is tricky in crypto.
Extreme fear can create great opportunities in Bitcoin, but it can also arrive too early. Many traders see a fearful market and immediately assume it is time to buy. I think that is dangerous.
Fear becomes useful only when price starts confirming that sellers are running out of strength.
For sentiment, I check the Alternative.me Crypto Fear & Greed Index and the CoinMarketCap Fear & Greed Index. They are not perfect, but they give a quick read on whether the market is leaning toward panic, neutrality, or greed.
Here is how I would read sentiment around a $60K break:
- Fear spikes and BTC reclaims $60K — possible bear trap.
- Fear spikes and BTC stabilizes between $58K–$56K — possible base-building zone.
- Fear spikes and BTC keeps closing lower — risk remains high.
- Fear stays mild while price breaks down — traders may still be too comfortable.
The last point is important. Sometimes the best bottoms form when almost nobody wants to buy. If everyone still expects an easy bounce, the market may not have cleared enough excess yet.
Data Sources I’ll Reference Without Turning The Article Into A Data Dump
I do not want to bury the Bitcoin $60K support story under fifty charts. Too much data can make traders feel smart while making decisions harder.
So I keep my dashboard focused on a few key questions:
- Where is forced selling happening?
I check Coinglass liquidations, Coinglass BTC liquidations, and the BTC liquidation heatmap. - Where is Bitcoin relative to its long-term trend?
I use Coinglass 200WMA, Newhedge, Bitbo, Yahoo Finance, and Phemex’s 200-week moving average guide. - Are experienced holders selling or staying patient?
I watch Glassnode long-term holder supply, Glassnode long-term holder net change, and the Glassnode LTH/STH essentials dashboard. - Is the market fearful enough to create opportunity, or still too relaxed?
I compare the Alternative.me Fear & Greed Index with the CoinMarketCap Fear & Greed Index. - What is the broader market narrative?
I read coverage like Crypto.news’ Bitcoin price prediction analysis, but I always bring it back to price action and on-chain behavior.
Once I have those signals lined up, the next question becomes much sharper: does Bitcoin turn the $60K break into a trap, a range, or a real downside continuation? That is where the next 30 days get interesting.

What History Says Could Happen In The Next 30 Days
History does not give me a guaranteed Bitcoin price target. It gives me behavior patterns.
When BTC retests a major support level, I usually see one of three paths: a fast reclaim, a boring chop, or a deeper flush before the market finds real demand again.
The first break gets attention. The acceptance below the level does the real damage.
There are good examples of all three. In March 2020, Bitcoin broke hard with global markets, then snapped back once forced selling faded. In May to July 2021, BTC spent weeks chopping after a brutal selloff before reclaiming strength. In late 2018, the famous $6K support finally failed, and once the market accepted price below it, BTC moved quickly toward the low $3K area.
That is why I do not treat one candle as the full story. I care about daily closes, liquidation pressure, spot demand, sentiment, and whether long-term holders stay calm or start distributing.
This lines up with broader crypto research too. In Risks and Returns of Cryptocurrency, Liu and Tsyvinski found that crypto returns have meaningful momentum and investor-attention effects. In plain English: when everyone is staring at the same level, price can move further than people expect in either direction.
Scenario 1: BTC Reclaims $60K Quickly
This is the cleaner bullish case.
If Bitcoin slips below $60K, shakes out late longs, then quickly climbs back above it, I would treat that as a possible bear trap. The key word is quickly. A reclaim that happens within a short window is very different from a weak bounce that gets rejected under the level.
In this scenario, I want to see:
- Daily closes back above $60K, not just a wick.
- Spot demand improving, so the bounce is not only futures-driven.
- Liquidation pressure cooling on tools like Coinglass BTC liquidations.
- Funding rates calming down, instead of traders instantly piling into reckless leverage again.
- Fear stabilizing on sentiment gauges like the Crypto Fear & Greed Index.
If that happens, late shorts can get trapped. Traders who sold the break may be forced to buy back higher, and that can fuel a relief move toward nearby resistance. For me, the first area to watch would be the old breakdown zone above $60K, especially around the $62K to $64K region if buyers show strength.
I would not call that a full trend repair by itself. It would simply tell me that the market rejected lower prices, at least for now.
Scenario 2: BTC Chops Between $56K And $62K
This is the frustrating middle path, and honestly, it may be the most realistic one if neither bulls nor bears have enough strength to finish the move.
In this setup, Bitcoin can move sideways for days or even weeks. Headlines stay negative. Social media gets loud. Traders get chopped up. One day looks like a breakdown, the next day looks like a recovery, and then price returns to the middle of the range.
That kind of market can feel useless, but it can actually serve a purpose. It can reset leverage, cool down funding, and give serious buyers time to build positions without chasing green candles.
For this range to become constructive, I would want to see:
- Lower liquidation spikes over time, meaning forced selling is fading.
- Neutral or calmer funding, showing that leverage is not heavily leaning one way.
- Long-term holder supply staying stable on charts like Glassnode’s long-term holder supply.
- Fear staying high but price refusing to make new lows, which can hint that sellers are running out of energy.
The danger in this scenario is overtrading. The middle of a range is where traders often make emotional decisions. I would rather see Bitcoin prove itself near the edges: either reclaim $62K with strength, or lose $56K with clear downside pressure.
Scenario 3: BTC Loses $60K And Fails To Recover
This is the bearish case, and it is the one I take seriously if Bitcoin starts accepting price below $60K.
A brief move under support is not enough to scare me on its own. What worries me is a failed reclaim. If BTC breaks below $60K, tries to bounce, and then gets rejected under that same level, the market message changes.
That would tell me former support may be turning into resistance.
In that case, I would look for confirmation through:
- Repeated daily closes below $60K.
- Weak bounces that fade fast.
- Rising long liquidations and lower liquidity pockets on the Coinglass BTC liquidation heatmap.
- Long-term holder net position change turning negative on Glassnode LTH net change.
- Fear getting worse without price stabilizing.
If those signals stack together, I would shift my focus away from dip-buying excitement and toward risk control. The lower zones already matter more in that situation, especially the $58K to $56K area first, then the bigger $52K to $50K region if selling pressure keeps building.
The market does not need a dramatic new story for that to happen. Sometimes all it takes is trapped leverage, weak spot demand, and enough traders realizing at the same time that the bounce is not coming yet.

My 30-Day Playbook For Cryptolinks Readers
For the next 30 days, I would keep this simple. I do not want to marry one opinion when Bitcoin is sitting near a major decision point.
- If BTC is above $60K and holding, I watch for confirmation.
I want to see strong closes, better volume, and less panic in derivatives. Holding the level matters, but clean follow-through matters more. - If BTC is below $60K but reclaiming fast, I watch for a bear trap.
A fast reclaim can punish late shorts and create a relief bounce. I would still want proof from spot demand, not just a futures squeeze. - If BTC is below $60K and liquidations accelerate, I focus on risk first.
I do not like fighting liquidation cascades. In those moments, capital protection matters more than trying to catch the exact bottom. - If long-term holders start selling heavily, I take the downside case more seriously.
Short-term traders panic all the time. Long-term holders moving coins aggressively is a different signal, and I would not ignore it. - If fear spikes but price stabilizes, I look for signs of accumulation.
Fear alone is not a buy signal. But fear plus stable price action plus reduced leverage can create a much better setup.
My rule here is simple: I do not need to be early to every move. I would rather be a little late with confirmation than early into a liquidation flush.
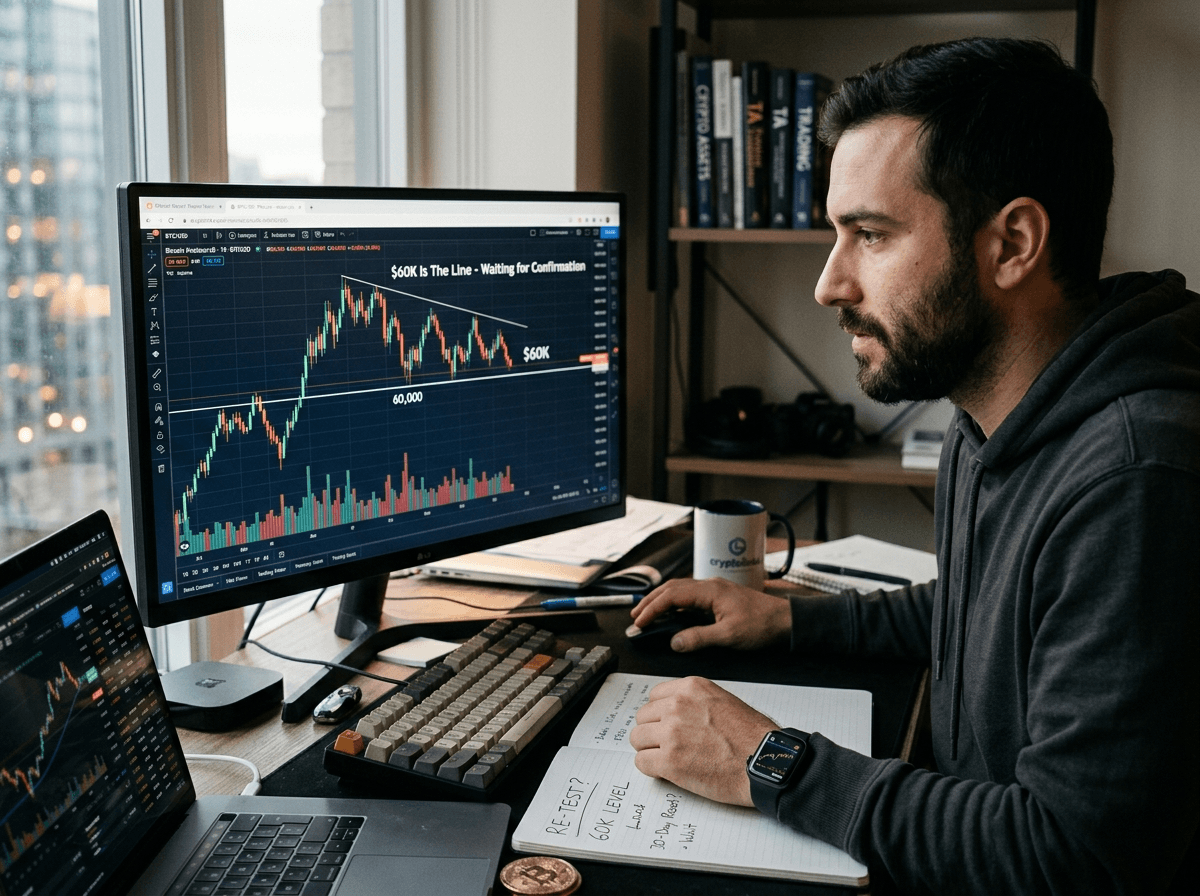
Final Take: $60K Is The Line, But Confirmation Is The Story
$60K matters, but it does not decide the whole Bitcoin cycle by itself.
The next 30 days are likely to come down to reclaim strength, liquidation pressure, long-term holder behavior, and whether fear turns into forced selling or patient accumulation.
If Bitcoin reclaims $60K quickly, the market gets room for a relief bounce. If BTC chops between $56K and $62K, I would expect frustration but also a possible leverage reset. If Bitcoin loses $60K and cannot recover it, I would respect the downside risk and stop pretending the break is harmless.
That is my market read: do not panic over the first move, but do not ignore acceptance below support either.
This is not financial advice. It is my research-based view of the Bitcoin setup as I see it right now.