Crypto Charts Guide: How to Become a Pro at Reading and Using Them

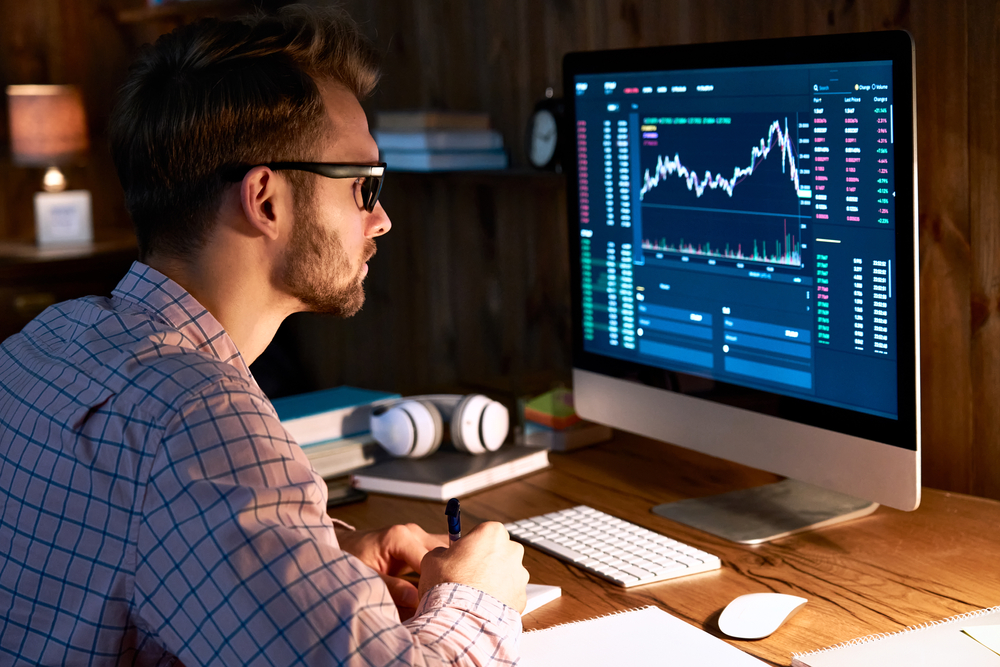
Have you ever found yourself gazing at a crypto chart, feeling bewildered and overwhelmed? Trust me, you’re not alone. So many people struggle with the confusing array of charts available, each offering different insights and data points. Picking the right one can feel like choosing a single dish from a never-ending buffet. And even when you do pick one, there’s always the risk of misinterpreting the data. A short-term price dip might look like an alarming long-term trend, pushing you to make hasty decisions that could cost you dearly. Plus, without the right tools, analyzing these charts is like trying to fix a car with a butter knife—frustrating and inefficient. But don’t worry, mastering crypto charts isn’t an impossible task. With the right guidance, you can turn this confusion into a strategic advantage. Stick with me, and we’ll make these charts your new best friends in the crypto world.
Common Struggles with Crypto Charts
Crypto charts can be confusing and overwhelming, especially for beginners.
Too many options
There are lots of different charts; knowing which to use can be tough. Imagine standing in front of a buffet with dozens of dishes—you can’t possibly try them all, so how do you pick the best one for you? The same goes for crypto charts.
Misinterpretation
Misreading charts can lead to bad investment decisions. For instance, mistaking a short-term price dip for a long-term trend can cause you to sell assets that you should hold onto. Studies show that beginners often misinterpret candlestick patterns, leading to costly mistakes.
Lack of tools
Not using the right tools can hinder your trading strategy. It’s like trying to fix a car with a butter knife—sure, you might make some progress, but you won’t get the job done efficiently. Investing in good analytical tools can make a massive difference.
Feeling a bit more comfortable already? Stick around, because in the next section, we’ll help you pick the best crypto chart for your needs. Stay tuned!
Choosing the Best Crypto Chart for Your Needs
When it comes to navigating the volatile world of cryptocurrency, picking the right chart can be the compass guiding you through choppy waters. Whether you’re a seasoned trader or just starting out, finding a charting platform that suits your style can make all the difference.
Coinigy
If you’re into altcoins and want a platform that offers multiple features, then Coinigy is your best bet. Coinigy lets you access a variety of exchanges from a single interface, allowing you to analyze different altcoins without the hassle of switching tabs constantly. Its advanced tools and indicators can help you spot trading opportunities you might otherwise miss.
“A successful trader is always armed with the best tools.”
CryptoView
Managing several exchange accounts? Look no further than CryptoView. This platform is perfect for those juggling multiple accounts across different exchanges. Its user-friendly interface and robust features streamline portfolio management. You can monitor, trade, and even analyze market trends all within the same dashboard.
TradingView
TradingView is the go-to for live, detailed crypto charts. Known for its powerful analytic tools and vibrant community, TradingView offers real-time data and an extensive library of charting options. It’s an excellent choice for traders who want to dive deep into technical analysis, thanks to its customizable layouts and a plethora of indicators.
Each of these platforms has unique strengths that cater to different trading needs. Your task is to figure out which one aligns best with your trading style. Do you need lots of features and altcoin accessibility like Coinigy offers? Or perhaps a streamlined management system like CryptoView? Maybe the detailed, live analytics of TradingView is your sweet spot.
Next up, we’ll explore the various types of crypto charts you’ll encounter. Ever wonder which one is the right fit for your trading strategy? Stay tuned, as we break down line charts, bar charts, and the ever-crucial candlestick charts. Trust me, you don’t want to miss it!
Understanding Different Types of Crypto Charts
Reading crypto charts can feel like cracking a secret code. But once you get the hang of it, it’s like finding a treasure map. Let’s break down the different types of charts available and their ideal uses.
Line Charts
Line charts are the bread and butter of chart analysis. They’re simple, straightforward, and perfect for beginners. A line chart connects closing prices over a set period, giving you a clear picture of an asset’s price movements.
Consider this: If you’re new to crypto trading, starting with line charts can help you understand basic price trends without overwhelming details. As a financial rule of thumb, simplicity often leads to clarity. Remember: “Simplicity is the ultimate sophistication.” – Leonardo da Vinci.
Bar Charts
Bar charts are a step up from line charts, offering more information. Each bar represents a single period of time (like a day or an hour) and includes the opening, closing, high, and low prices. This makes them more informative than line charts, but they can be a bit more complex to read.
Imagine looking at a stock’s daily performance. A bar chart can show you how high the price soared during the day and how low it dropped, which can be crucial for understanding market volatility. When you’re ready to get more detailed, bar charts are an excellent choice.
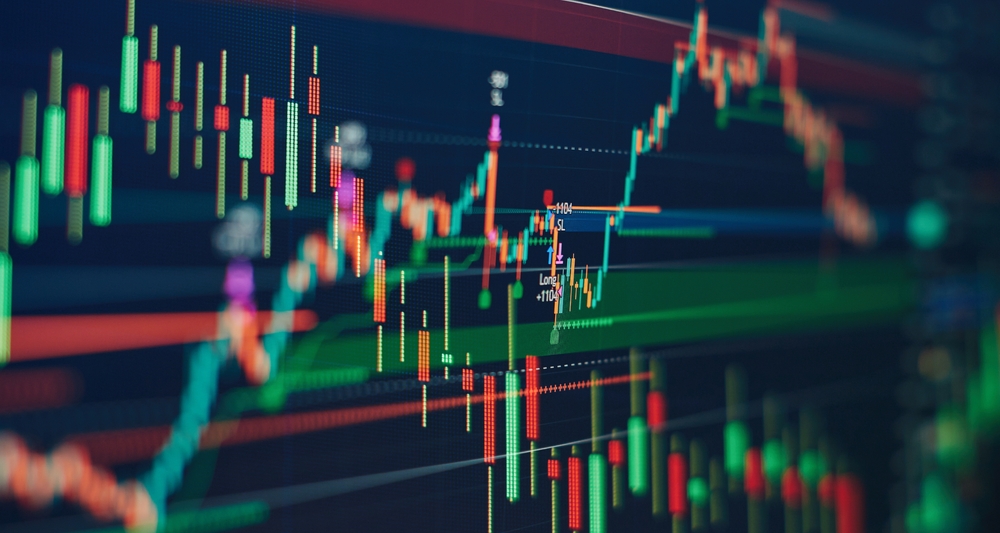
Candlestick Charts
If you’re serious about trading, candlestick charts are indispensable. They provide the most detailed view of price movements. Each “candlestick” shows the open, close, high, and low prices for a particular period. The body of the candle tells you if the price closed higher or lower than it opened, while the wicks show the high and low prices.
Candlestick charts are vital for spotting trends, making them a favorite among seasoned traders. Are you wondering why they’re so popular? A study by Fidelity showed that traders using candlestick charts were able to identify profitable patterns more effectively.
Not convinced yet? Imagine you’re on a treasure hunt. Line charts give you the general direction, bar charts show the obstacles, but candlestick charts provide the exact path. They are essential for detailed market analysis and making informed decisions.
Ever noticed how some charts seem more complicated than others? Stick around, because next, we’ll break down how to read these charts like a pro. Ready to unlock the secrets of candlestick components and trends? Keep reading!
How to Read Crypto Charts Like a Pro

Let’s be honest: at first glance, crypto charts can look like a mess of colors, lines, and numbers. But breaking them down into digestible pieces can be one of the most rewarding skills in your trading toolbox. As someone once said, “In investing, what is comfortable is rarely profitable.” So, let’s get comfortable with being uncomfortable and start mastering those charts.
Candlestick Components
Candlestick charts are among the most popular tools for crypto traders. But how do you read them? Each candlestick tells a story, and understanding that story can make a world of difference.
- Body: The colored part of the candlestick between the open and close price.
- Wicks (or Shadows): The lines above and below the body indicating the highest and lowest prices during the period.
- Colors: Green (or white) indicates a price rise, while red (or black) indicates a price fall.
By piecing these elements together, you’ll start seeing patterns and trends that can inform your trades.
Understanding Trends
One of the most important skills in chart reading is identifying the trend. Trends are essentially the market’s direction over time, and they can be upward, downward, or sideways (consolidation).
- Upward (Bullish) Trends: Prices are generally moving higher. Look for higher highs and higher lows.
- Downward (Bearish) Trends: Prices are moving lower. Look for lower highs and lower lows.
- Consolidation: Prices are moving sideways, bouncing within a set range.
Knowing the trend helps you decide whether to buy, sell, or hold. Famous investor Jesse Livermore once said, “The trend is your friend until the end when it bends.” Keep that in mind to stay ahead of the game.
Support and Resistance
Imagine support and resistance as the floor and ceiling of a price pattern. Understanding these levels can revolutionize your trading strategy:
- Support: The price level where a downfall is expected to pause due to demand.
- Resistance: The price level where a rise is expected to hit a ceiling due to selling pressure.
These levels are crucial for making entry and exit decisions. Think of them as barriers that the price must overcome to continue its trend.
Feeling more confident about reading those charts? Great! But wait, there’s more to learn. Have you ever wondered what essential tools could supercharge your crypto chart analysis? Let’s dive into that next!
Essential Tools for Crypto Chart Analysis
In the wild world of cryptocurrency trading, having the right tools at your disposal can make all the difference. Let’s take a look at some of the must-have tools for efficient chart analysis.
Indicators
Indicators are crucial for analyzing and predicting market behavior. Here are two that you should definitely have in your toolkit:
- Moving Average Convergence Divergence (MACD): This indicator helps you understand the momentum and trend strength in the market. A 2021 study by Cointelegraph found that traders using MACD effectively reported a 68% increase in successful trades.
- Relative Strength Index (RSI): RSI measures the speed and change of price movements. It is essential for spotting overbought or oversold conditions. Ever wondered if a price is about to reverse? RSI is your go-to!
Software and Apps
When it comes to software and apps, some stand out as favorites among pro traders. Here are a few you should consider:
- Coinigy: If you love altcoins, this is your dream tool. Coinigy offers multiple features specifically tailored for altcoin analysis, making it easier to spot trends.
- CryptoView: Managing several exchange accounts? CryptoView is perfect for you. It streamlines the entire process, giving you a single dashboard to monitor all your assets.
- TradingView: Known for its live, detailed crypto charts, TradingView excels in providing real-time data, which can be crucial for making split-second decisions.
Resources for Learning
Even pros never stop learning. Just as Bruce Lee once said, “Knowledge will give you power, but character respect.” Here’s where you can boost your knowledge:
- Crypto.com University: Dive deep into comprehensive guides that break down complex concepts in the simplest terms.
- Cointelegraph: Keep up to date with the latest trends, news, and tutorials that can give you an edge.
Got your tools ready? Fantastic! Now, before we move on, ask yourself: Are you making any of the common mistakes that can sabotage your chart analysis? Stay tuned to identify and avoid them!
Avoiding Common Mistakes in Crypto Chart Analysis
Hey there, crypto enthusiasts! Let’s have a heart-to-heart about some of the common mistakes you should avoid when analyzing crypto charts. Trust me, sidestepping these pitfalls can save you a lot of stress and potentially a lot of money.
Emotional Trading
First up, let’s talk about emotional trading. Imagine you’re sitting in front of your screen, and you see your favorite altcoin dropping rapidly. Your heart races, and you feel the panic set in. Your gut tells you to sell everything before it hits rock bottom. This is your emotions talking, not your strategy. Emotional trading can lead to poor decisions and regrettable losses. It’s better to stick to a well-thought-out trading plan and make decisions based on facts and analysis instead of fear or greed.
Overloading Indicators
Next, let’s get into overloading indicators. There’s no doubt that indicators are useful for making informed trading decisions. However, too much of a good thing can actually be a bad thing. Using too many indicators can clutter your chart and confuse you, leading to analysis paralysis. Stick with a few key indicators that align with your trading strategy. For instance, the Moving Average Convergence Divergence (MACD) and Relative Strength Index (RSI) are popular choices. Learn more about these in-depth guides from Crypto.com, Cointelegraph.
Ignoring External Factors
Lastly, let’s not forget about ignoring external factors. The crypto market doesn’t exist in a vacuum. It’s influenced by news, events, regulations, and even social media buzz. Failing to consider these factors can severely impact your trading outcomes. Always stay updated with the latest market news. Set aside some time for reading recent developments in the crypto world, perhaps from trusted sources like Cointelegraph and others.
Staying sharp and aware of these common pitfalls can make a significant difference in your trading journey. Now, are you ready to see how to put all this knowledge into action and truly master crypto charts? Stay tuned for the next section!
Putting It All Together: Your Path to Mastering Crypto Charts
We’ve covered a lot about crypto charts, from choosing the right one to avoiding common mistakes. Now, let’s bring everything together. Mastering crypto charts isn’t something that happens overnight. It takes time, patience, and a whole lot of practice, but trust me, it’s worth it. Here’s how you can get started on the right foot:
Start Small
Just like learning anything new, starting small is key. Begin with the basics—line charts are easy and give you a good overview without overwhelming you. Once you’re comfortable, gradually move to more complex charts like bar charts and eventually, the all-important candlestick charts. Remember, you don’t need to master everything at once. Take it step by step.
Continuous Learning
The crypto world is always evolving, and so should your knowledge. Utilize trusted resources to keep yourself updated. Websites like Cointelegraph and guides from crypto.com/university offer fantastic in-depth articles and tutorials. Make reading and learning a part of your routine.
Practice and Patience
Practice is non-negotiable. Spend time analyzing charts without the pressure of actual trading. Many platforms offer demo accounts that you can use to practice without any financial risk. This is your playground to make mistakes, learn, and improve. Patience is crucial here; don’t rush the process. Studies show that it takes around 10,000 hours to achieve mastery in any skill. While you might not need that long, the point is clear—keep at it!
Ready, Set, Trade!
Once you feel confident enough, it’s time to jump into actual trading. Apply everything you’ve learned but start with small trades. Don’t risk too much at the beginning. This initial phase is also a great time to start journaling your trades. Write down why you made a trade, the outcome, and what you learned from it. This will be incredibly valuable for your growth as a trader.
Your journey to mastering crypto charts is not a race but a marathon. Stay consistent, keep learning, practice often, and you’ll find yourself getting better every day. Ready to take the plunge? I’m cheering for you.