Analyzing the Volatility of Meme Coins
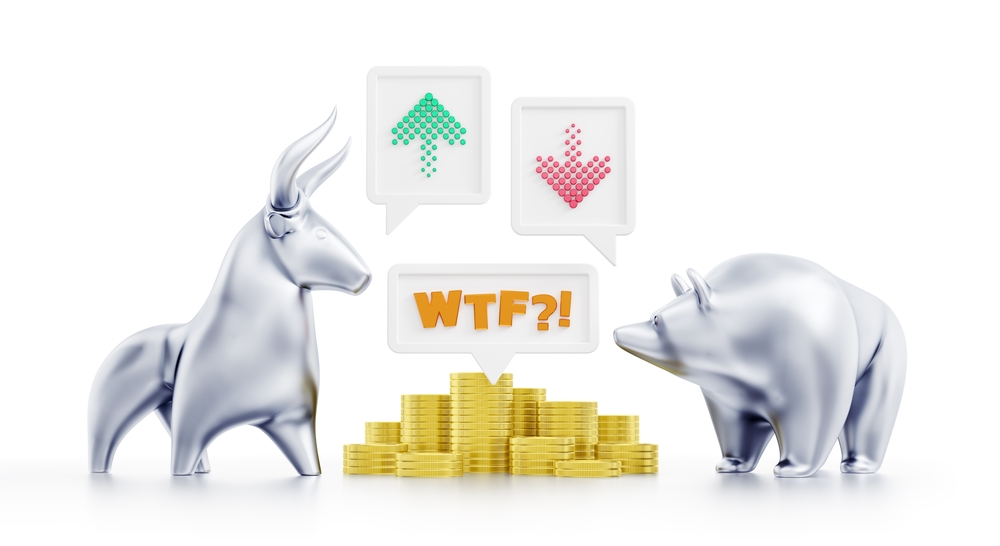
Ever watched a meme coin rip 70% before your coffee cools, then crater by lunch, and wondered what just hit you? I’ve worn that whipsaw—FOMO buys, nasty slippage, charts rugging while timelines cheer—so on Cryptolinks.com News I cut the noise and share the playbook I use: read real signals, respect liquidity, track attention, manage size and exits, and run quick checks to spot traps early. No hype, just steps that keep you from being exit liquidity when tweets, listings, and thin books yank price around. Want fewer scars and smarter entries? Keep reading—here’s what actually flips the switch and how I handle it.
The pain: FOMO, whipsaws, and “what just happened?”

Meme coin volatility isn’t gentle. It’s fast, social-driven, and unforgiving. If you’ve:
- Chased a green candle on a fresh ticker, only to get slapped by a 20% retrace minutes later…
- Slipped 10% on a single market buy because liquidity vanished when everyone piled in…
- Watched a “can’t-lose” chart rug while Twitter cheered the top…
…you’ve met the beast.
“Fast moves feel like opportunity. In thin markets, they’re often exits for someone else.”
Real examples are everywhere. When Twitter briefly swapped its logo for Doge in 2023, DOGE spiked hard, then recoiled. When PEPE hit Binance later that year, it surged on listing hype—and whipsawed as liquidity adjusted and early holders took profits.
There’s data behind this too. Research has shown that social attention can lead both price and volatility in crypto:
feedback loops between social media and Bitcoin activity were documented in a PLOS ONE study (Garcia et al., 2015), and attention proxies like Google Trends and Wikipedia views correlate with crypto moves (Kristoufek, 2013). If that’s true for BTC, imagine the effect on thin, narrative-only assets with shallow order books.
What I promise you’ll get
By the end of this series, you’ll have a clear, usable playbook for meme coin volatility—not theory, but practical steps I actually use:
- What really moves meme coins (incentives, liquidity, and attention), in plain English.
- How to read volatility with simple signals, so you stop trading the noisiest chop.
- Risk rules you can follow on a busy day: sizing, entries, stops, and exits.
- Tools that won’t waste your time: fast checks for liquidity, on-chain concentration, and event risk.
- Mini case studies (DOGE, SHIB, PEPE, BONK) to connect patterns with reality.
No magic indicators, no hidden paywall—just what’s worked for me reviewing crypto platforms every day.
Who this is for and what you’ll need
This is built for anyone who’s curious about meme coins or already trading them—with a focus on survival first. You’ll get the most from it if you bring:
- A willingness to skip bad setups. Bored trades are expensive.
- A plan to manage size. Tiny positions while you’re testing, fixed risk per trade when you’re serious.
- Basic tools you likely already have: a charting app, a DEX screener, a block explorer, price/news alerts.
- Boundaries: max daily loss, no chasing after two green candles, and a “do nothing” option.
Nothing here is financial advice. It’s a practical guide to navigating social-fueled markets where liquidity and attention shift faster than most traders can react.
Ready to understand why these coins swing so violently—so you can stop being exit liquidity? Up next, I’m unpacking the real drivers behind the madness: social feedback loops, liquidity gaps, tokenomics landmines, whales, and leverage. Which one do you think flips the switch most often?
What makes meme coins swing so hard?

If you’ve ever watched a meme coin rip 50% on a random Tuesday and then free‑fall before your coffee cools, here’s the honest reason: these things live at the intersection of attention and thin liquidity. That combo turns small sparks into bonfires—fast.
“Markets can stay irrational longer than you can stay solvent.”
— John Maynard Keynes
I’ve learned to respect that line. Meme coins aren’t “irrational” by accident—they’re engineered (socially and structurally) to move in bursts. Here’s what actually fuels the chaos.
Social media feedback loops
Meme coins are attention assets. The price is a reflection of how loud, how sudden, and how coordinated the conversation gets. The loop is simple and brutal:
- Attention spikes on X/Twitter, TikTok, Discord, Telegram.
- New buyers rush in, volume jumps, spreads widen, price gaps up.
- FOMO accelerates as green candles get screenshotted and shared.
- Reflexivity kicks in: rising price creates more attention—until it flips to fear and unwinds just as fast.
Real sample: when Twitter briefly swapped its bird logo for the Doge icon in April 2023, DOGE popped ~30% within hours and then bled back once the novelty faded (Reuters). That wasn’t “fundamentals”—it was pure attention energy.
There’s data behind this too. Research shows that attention proxies like Google Trends and Wikipedia views correlate with crypto price and volatility—more eyeballs, more movement (Kristoufek, 2013). Another study on coordinated “pump” groups found social channels can trigger synchronized surges in illiquid coins (Hamrick et al., 2018).
Translation: a viral meme or a celebrity wink can effectively be the catalyst. You feel it in your gut first—and in the chart a few minutes later.
Liquidity and market microstructure
Most meme coins don’t have deep, stable markets. That’s why identical orders can have wildly different outcomes depending on where and when you place them.
On-chain (AMMs like Uniswap):
- Prices move along a constant‑product curve; the larger your order vs. the pool, the worse your price impact—nonlinearly. A $10k buy in a $200k LP can shove the price multiple percent in a heartbeat.
- LP can appear and vanish; your slippage in a “hot” five-minute window can be 10x worse than it was an hour ago.
- Fragmentation is real: multiple pools, multiple routers, and cross‑chain versions of the same ticker.
Centralized exchanges (CEXs):
- Deeper order books on big names (think DOGE, SHIB), but micro‑cap memes may only have a few hundred thousand dollars of real bid depth within 2%.
- Spreads and liquidity vary by venue; your fill quality can hinge on whether market makers are active that hour.
If you want the mechanics, Uniswap’s constant‑product model explains why price impact accelerates as size increases (Uniswap docs). In plain English: thin pools amplify every nudge.
Quick tells I watch before I press buy:
- 2% depth on both sides (how many dollars until price moves 2%).
- Total LP vs. my order (if I’m >1–2% of the pool, that’s a red flag).
- DEX + CEX volume mix (fragmented liquidity = jumpier price).
- Spread and slippage at my size during the time of day I actually trade.
Tokenomics that fuel spikes and crashes
Some meme coins hard‑wire volatility into the contract. A few common quirks:
- Taxes and reflections: Buy/sell taxes (e.g., 5–10%) and “reflection” payouts can deter selling during pumps, forcing price up faster—until the crowd rushes to exit and pays the toll on the way out. Think of early SafeMoon mechanics where selling was painful and green candles looked irresistible.
- Burns: Real or promised burns (e.g., SHIB burn campaigns) can tighten circulating supply narratives, supercharging hype waves—then reality sets in if burns are small vs. daily volume.
- Unlock schedules: Team, investor, or ecosystem unlocks can create predictable air pockets. A quiet chart can snap lower when a tranche hits and liquidity isn’t there to catch it.
- LP controls: Is LP locked? Renounced? If a single wallet can pull or reallocate LP, you don’t just have volatility—you have existential risk.
- Supply concentration: A handful of top wallets equals a hair‑trigger market. One whale deciding to derisk = cascading sell pressure.
My fast checklist before I touch a fresh ticker:
- Is there a buy/sell tax? If yes, how much—and where does it go?
- Any reflections/burn claims? Are they mechanical or just promises?
- When are the next unlocks (team, advisors, ecosystem)?
- LP status: amount, lock duration, ownership of the contract.
- Top holder distribution and any centralized treasury wallets.
Each of these quirks can take a normal move and crank it to 11. Great when you’re early; ugly when you’re late.
Whales, leverage, and exchange flows
Even with no news, a few large players can swing a meme coin. Add leverage and listings to the mix, and you get stampedes.
- Whale wallets: When a top holder sends tokens to a CEX, that’s often prep for selling. If multiple whales rotate at once, bids vanish and price air‑drops.
- Perp funding flips and OI spikes: For larger memes (DOGE, SHIB, PEPE, BONK), perpetual futures funding rates turning strongly positive can signal crowded longs—ripe for a squeeze. Negative funding with rising open interest can set up violent bear squeezes when price nudges up (Binance Academy).
- Listing and relisting news: Venue upgrades change who can buy. When PEPE landed on Binance in May 2023, it ripped into the announcement and after spot went live—then whipsawed as late buyers met early distribution.
- Cross‑venue flow: If volume migrates from DEX to CEX (or from one chain to another), the old pool/book thins out. Breakouts and breakdowns become more violent when “real” liquidity moves elsewhere.
Signals I watch so I’m not someone else’s exit:
- Large inflows to exchanges from top wallets right before peaks.
- Funding rate spikes with lagging spot—classic fuel for a squeeze.
- Open interest + price divergence (OI climbing while price stalls = coiled spring—but direction can flip on a headline).
- One‑sided order books and pinned prices with vanishing bids—distribution in plain sight.
It’s messy, but there’s a pattern: social energy lights the fuse, thin liquidity multiplies the move, tokenomics tilt the table, and whales/leverage decide how far it runs.
So the next obvious question: can we actually measure when this powder keg is about to go off—and step aside when it’s all noise? I’ll show you the exact volatility metrics I track and how I use them in the next section.
Can we measure and anticipate volatility?

I can’t predict every meme coin wick, but I don’t have to. I measure the heat, watch for pressure building, and plan around the moments when the market tends to explode. That’s how I avoid being the last buyer on a green candle.
“Volatility isn’t the enemy. Unmanaged risk is.”
Here’s what I track every day to keep the chaos on a leash.
Realized vs. implied volatility, ATR, and band width
Realized volatility is what already happened (how wildly price moved). Implied volatility is what the options market expects to happen next. Most meme coins don’t have options, but a few do (DOGE, sometimes SHIB), and when they do, I pay close attention. When IV rips far above realized vol, it often means the crowd is paying up for protection or moon tickets—great context for risk.
When options don’t exist, I use two dead-simple indicators that work in thin markets:
- ATR (Average True Range, 14): I convert it to a percentage of price (ATR/price). If ATR% jumps from, say, 4% to 9% in a day, I size down or widen stops—conditions changed. I also set stop distances using a multiple of ATR so I’m wrong on structure, not on noise.
- Bollinger Band Width (BBW): Band Width = (Upper–Lower)/Middle. I rank today’s BBW against the past 90 days. When BBW is in the bottom 15–20% of its 90‑day range, that’s a “compression.” I get alerts for these because compression often precedes expansion.
A quick pattern I trust:
- Compression → Expansion: Low BBW + rising OBV (more on OBV below) = I prep a breakout plan. If BBW is low but OBV is flat or falling, I wait—often a fake-out.
- ATR shock: If BBW is mid-range but ATR% spikes hard while funding flips positive, I assume we’re entering a fresh volatility regime and manage tighter.
Example that still sticks with me: before one of PEPE’s early legs in 2023, BBW sat near multi-week lows while spot volume crept higher. Two sessions later, the bands blew open and trend traders feasted. It wasn’t magic—just pressure building in plain sight.
For the stats-inclined, volatility clustering isn’t just a chartist myth; it’s a documented market behavior going back decades (ARCH/GARCH literature). Crypto shows the same pattern: quiet begets quiet, chaos begets chaos. That’s why ATR and BBW are worth your screen space.
Volume and momentum tells
Momentum in meme coins is messy because slippage and bots can fake strength. I filter it with a few rules:
- OBV (On‑Balance Volume): Price making higher highs while OBV stalls or makes lower highs = distribution. In thin markets, that’s often your “exit while it’s easy” cue.
- Volume surge vs. baseline: I compare current hourly/daily volume to the 20‑period average. Real breakouts usually ride a 3x+ volume burst. Sub-2x? I’m wary—it’s often a wick farm.
- RSI extremes with context: RSI > 70 doesn’t scare me if BBW just expanded and volume is exploding—that’s trend. But if RSI > 80 while volume fades and OBV diverges, I take profits. In meme coins, I love RSI pullbacks to 40–50 that hold above prior support during an uptrend.
I’ve seen this repeatedly on SHIB and BONK: the cleanest legs happen when price HH + OBV HH + 3x volume line up within a couple of candles. Miss one ingredient, and your breakout often turns into a round-trip.
On-chain signals that matter
In meme land, the chain tells the truth. A few 60-second checks can save you from being exit liquidity:
- Holder concentration: I note the % held by the top 10 and top 100 wallets. If the top 10 control 70–80% and they aren’t labeled CEX/LP, I assume two things: sharp squeezes up, brutal air pockets down. I’ll size smaller or pass completely.
- New wallet growth: Fresh buyers drive reflexive moves. I track daily new holders and active addresses. Rising price with flat or falling new holders = fragile. Rising price with accelerating new holders = reflexive feedback loop, the good kind.
- Velocity: Transfer volume relative to market cap. Spikes in velocity during compression often precede expansion. Spikes during distribution can signal churn—fuel without direction.
- LP health (for DEX pairs):
- Depth at 1–2% price impact: can your order size move price too much?
- LP lock status and ownership: unlocked LP next week? I usually wait.
- Mint/burn/admin privileges: if a single wallet can change taxes or freeze, your “volatility” might be a trap.
Small example: a Solana meme with a clean chart looked tempting, but top-10 holders had 82% and LP unlock was 48 hours away. I skipped. It popped 30% and then vanished 70% in a day. Sometimes “boring” on-chain checks are the best alpha.
Event catalysts and calendars
The wildest candles often happen around known events. I keep a simple calendar and plan like a professional pessimist:
- Listings (CEX/DEX upgrades): Price often runs into the event and chops or sells after. I scale out into strength rather than chase announcements. DOGE around big media moments is the famous example—pre-run, then whipsaw.
- Unlocks and vesting: If meaningful supply is about to hit the market, I reduce risk. Even if buyers absorb it, the path there is often messy. I set alerts 7 days and 24 hours before.
- Airdrops and snapshots: Flow shifts fast. Farmers rotate. I assume higher wick risk before snapshot times and keep slippage tighter or stand aside.
- Partnerships/celebrity mentions: Most “surprise” mentions aren’t on the calendar, but the reaction pattern is similar: instant IV shock (if options exist), volume blowout, then a reality check. If I didn’t have a position before, I avoid FOMO entries unless we base and re-accumulate on OBV.
Playbook I actually use:
- Tag events 72/24/1 hour out.
- Decide beforehand: position into the rumor, or only trade post‑event retests.
- During event windows, I use smaller size, wider stops (ATR-based), and faster profit taking.
There’s research showing social attention can fuel feedback loops in crypto prices—think of it as gasoline on already-dry tinder. That’s why I pair calendars with volume/OBV and those compression alerts. When attention spikes into compression, that’s the cocktail that moves markets.
If measuring the chaos is step one, understanding why the crowd suddenly cares is step two. Want to see how narratives and memes spark those compressions—and how I trade each phase without getting wrecked?
Narratives, memes, and the hype cycle

Underneath every wild candle is a story people want to believe. In meme coins, that story spreads faster than order books can keep up. When attention spikes, price follows; when the joke stops being funny, liquidity steps aside.
“Markets are stories told in numbers. In memes, the punchline is the chart.”
I track the narrative arc because it repeats. Not perfectly—but often enough to shape my risk and timing. Here’s how I map the hype cycle and what I actually do in each phase.
The four phases: spark, frenzy, distribution, hangover
Spark — The first ignition.
- On the chart: Tight range breaks; one or two tall green candles on rising but not yet crazy volume. Early shorts get squeezed.
- On socials: A rumor, a joke, a screenshot. Twitter keyword mentions rise, Google Trends ticks up, Telegram/Discord joins accelerate.
- What I do: I scale in small if liquidity can handle my size. I set a hard invalidation under the breakout base. No chasing if slippage is brutal.
- Real-world snapshot: Many PEPE spurts began with meme density shooting up on Twitter before major coverage arrived.
Frenzy — The echo chamber goes full send.
- On the chart: Vertical moves, widening spreads, and “one-minute staircases.” Bollinger Band width and ATR explode. Pullbacks get bought instantly—until they don’t.
- On socials: Trending hashtags, influencer threads, TikTok stitches. You see “I just bought” posts, not “What is this?” questions.
- What I do: I stop initiating new positions unless I’m trading a clearly defined intraday setup with tight risk. I ladder partial takes into strength. I assume exit conditions will be worse than entry.
- Real-world snapshot: DOGE during the SNL week was textbook frenzy: headlines everywhere, options chatter, then a fast air‑pocket the moment attention peaked.
Distribution — Strong hands sell to late arrivals.
- On the chart: Higher highs on lower momentum (RSI/MACD divergences), big wicks both ways, and volume that stays high but stops pushing price.
- On socials: Victory laps, price targets, and “next stop 10x.” Whales start moving chunks to exchanges; on-chain holder concentration nudges down.
- What I do: I’m scaling out, not in. I tighten stops below prior swing lows. If I missed it, I let it go—this is where FOMO turns into someone else’s exit.
- Real-world snapshot: SHIB’s mid-cycle rips often showed OBV flattening while price eked out marginal highs—classic distribution behavior.
Hangover — Gravity, meet disbelief.
- On the chart: Failed bounces, lower highs, and liquidity gaps. The “no-bid” moments appear between obvious levels.
- On socials: Excuses, then quiet. Engagement falls faster than market cap. “When recovery?” posts outnumber memes.
- What I do: I’m out or small. If I trade it, I only touch clean reversal structures with proof of buyers returning (shift in market structure plus sustained volume).
- Real-world snapshot: After high-profile listings, some meme coins spend weeks grinding down as attention rotates. That’s not “cheap,” that’s post‑narrative.
Why this lens matters: Multiple studies link social attention to crypto volatility. Twitter volume and sentiment have shown predictive power for near‑term moves in digital assets (see research from The TIE and on‑chain/social analytics from Santiment). When attention flips, price often follows—both ways.
Rumor vs. confirmation
Buy the rumor, sell the news isn’t a meme—it’s a survival rule in thin markets.
- Rumor phase: Better risk/reward if the narrative has room to spread and liquidity can absorb entries. I size smaller, expect fakeouts, and avoid leverage. I pre‑decide to de‑risk into the first vertical move.
- Confirmation phase: After the official tweet or listing, spreads widen and slippage spikes. I only trade if the first pullback builds a higher low on strong, sustained volume—otherwise I let the crowd fight it out.
- Evidence in the wild: “Listing runs” are common: price trends up into big announcements, then chops or retraces once the news is public. Kaiko’s market microstructure notes show liquidity thins around event time, which makes chasing confirmations extra costly (Kaiko Research).
- How I position: If I’m early, I scale out before the announcement. If I’m late, I wait for post‑news structure to form. No entries inside the first few minutes of a major catalyst—execution is worst when emotions are highest.
Timing questions people always ask
- How long do pumps last? Micro-cap meme pumps often compress into 8–48 hours. Bigger names can run in waves across several sessions. The first leg is usually the fastest; later legs are choppier and more dangerous.
- Is weekend volatility different? Often yes. Liquidity is thinner and spreads are wider on weekends, which amplifies every order. Multiple data providers (including Kaiko) have shown depth tends to drop outside U.S./EU trading hours—great for big wicks, terrible for big size.
- Time of day effects? Volatility clusters around U.S. morning and key Asia open hours. If a catalyst hits near those windows, expect extra whipsaws as regions overlap.
- How do I know it’s “the top”? You won’t. But repeated failed highs on rising social noise, plus whales sending to exchanges, is my cue to take what the market gave me. Tops are a process—watch momentum, not hope.
- When do memes lose steam? Attention fatigue sets in fast. If social growth stalls while new wallet growth and volume fade, the narrative is aging. Fresh catalysts are oxygen; without them, gravity wins.
Here’s the uncomfortable truth: the same crowd that sends your bag 70% in an afternoon can vanish in an hour. Before you ride the next frenzy, are you certain the contract lets you exit, taxes aren’t hidden, and you won’t be the snack for a sandwich bot? In the next section, I’ll show the quick checks I run to avoid liquidity traps, rugs, and nasty contract surprises—so you can trade the story without becoming the story.
Liquidity traps, rugs, and contract risk
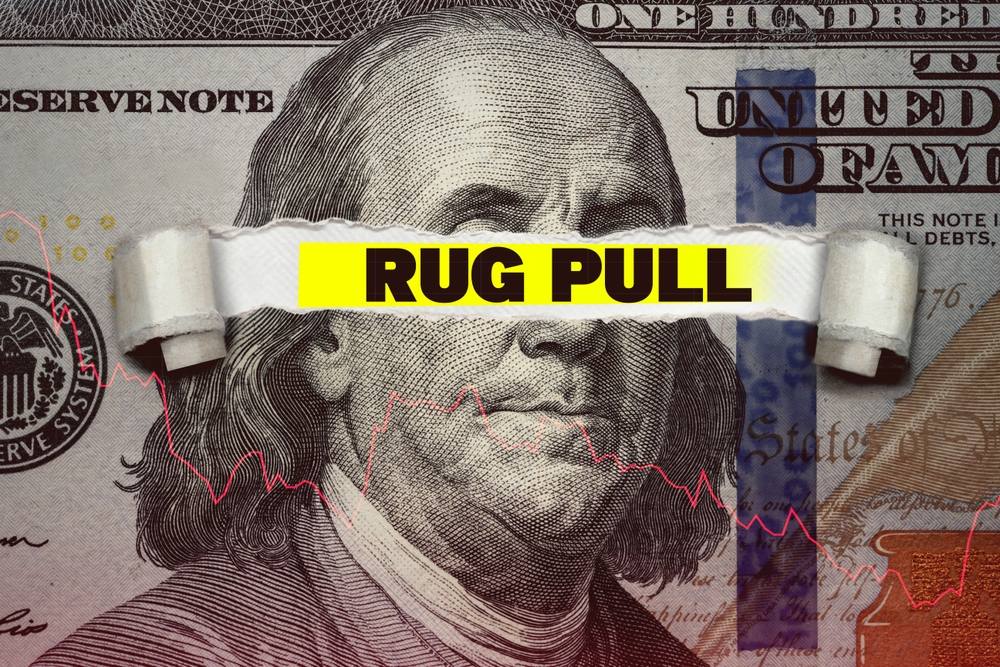
Let’s be real: the fastest way to blow up an account in meme coin land isn’t a bad entry—it’s a bad contract or a liquidity trap. I’ve watched tokens go vertical while buyers literally couldn’t sell (classic honeypot), or pay a 50% “anti-bot” tax they never agreed to. That’s not trading. That’s stepping into a buzz saw.
“Survive first. Then trade.”
Here’s how I stay out of the worst of it and what I check before touching a new ticker.
Honeypots are tokens you can buy but can’t sell. Hidden taxes drain you on entry/exit. Admin keys let a dev change the rules mid-game—or take the ball and go home.
Quick, practical checks I run in minutes:
- Test a tiny sell with a burner wallet. If the sell fails or needs wild slippage, you’ve got a problem. No exceptions.
- Scan for sell restrictions on EVM tokens:
- Look for “blacklist,” “maxTxAmount,” “tradingEnabled,” “cooldown,” or tax variables in Read/Write tabs on Etherscan.
- Use quick scanners like Honeypot.is, TokenSniffer, or De.Fi Scanner for EVM, and RugCheck for Solana. They’re not perfect, but they’ll catch obvious traps fast.
- Verify who controls the contract:
- If owner() is not renounced or tied to a multisig, risk is higher. A single dev wallet with god-mode is a no from me.
- For upgradeable proxies, check the ProxyAdmin. A renounced implementation means nothing if the proxy can be swapped.
- Look for a timelock on critical functions (24h+ is decent). No timelock = instant rug potential.
- Spot hidden taxes:
- Dynamic fee functions (e.g., setTaxFee, setSellFee) that the owner can crank to 99% on a whim.
- Wallets excludedFromFees sending/receiving with 0% tax while you pay full freight.
Receipts matter: the infamous SQUID token in 2021 pumped thousands of percent while blocking sells. Major outlets covered how buyers were trapped until the devs drained liquidity and vanished. It’s the textbook honeypot. If you don’t run the “can I sell?” test, you’re trusting strangers with your stack. Don’t.
And remember, rug/fraud is common. Solidus Labs reported over 188,000 tokens showing scam traits in a single year—most on EVM chains. Automated checks won’t catch everything, but they’ll save you from the obvious landmines.
Slippage, MEV, and sandwich attacks
Ever hit buy at the top tick, only to watch price snap back before your transaction confirms? That’s not just bad luck. In hot moments, MEV bots see your trade in the mempool and “sandwich” it—buying before you and selling into you. You pay worse execution, they pocket the spread.
Here’s how I reduce the bleed:
- Use MEV protection where possible:
- ETH: Route through Flashbots Protect, MEV Blocker, or use RFQ/auction-based order flow like CoW Swap and Matcha (0x) which often shields you from sandwiches.
- Solana: Prefer aggregators with protection routes (e.g., Jupiter’s MEV-aware paths) and avoid chasing during peak priority-fee wars.
- Keep slippage tight in thin books. I rarely go above 0.5–1% unless the liquidity is proven deep. If your trade needs 5–10% slippage to fill, the pool is too thin or too hot. That’s how accounts die.
- Set short deadlines (30–90 seconds) so your tx won’t execute on a stale price.
- Split orders or use TWAP. Breaking a $10k buy into smaller chunks often beats one fat market order in a shallow pool.
- Prefer limit/auction fills when volume is spiky. If you must market buy, do it when spreads narrow and gas wars cool down.
Back-of-the-napkin math: a 2% slippage on a $5,000 buy is $100 gone instantly. Get sandwiched for another 1% and you’ve handed $150 to the market before you even “trade.” Do that a few times and it doesn’t matter how good your ideas are.
Audits, code reads, and basic hygiene
Audits help, but they’re not a guarantee. They’re a snapshot of a moment in time—teams can push new code, flip fees, or upgrade proxies after the report lands. I treat audits as “one positive signal,” not a green light.
My pre-trade hygiene looks like this:
- Audit status: If there’s an audit, read the severity summary and check if findings were fixed. If there’s no audit, I expect stricter on-chain safeguards (multisig + timelock + LP lock).
- LP security:
- Check what % of supply is in the LP and where the LP tokens are. A lock on Unicrypt, Team Finance, or PinkLock is better than nothing—but be wary of fake screenshots.
- I like a liquidity-to-market-cap (L/MC) ratio above 5–10% for small caps. If L/MC is 1–2%, price can move 20–40% on modest size. That’s exit-liquidity territory.
- Ownership controls:
- Owner renounced or multisig? Timelock on tax/fee changes? Proxy admin visible?
- Any “pause” or “blacklist” functions? If yes, who controls them, and is there a timelock?
- Approval hygiene:
- Don’t hand unlimited spending to random routers. Periodically revoke approvals via Revoke.cash or Unrekt.
For a sober backdrop: Chainalysis has shown billions lost annually to exploits across DeFi, and while not every loss is a rug, the pattern is clear—attackers and shady devs follow the liquidity. Audits reduce risk; they don’t erase it.
Exit liquidity red flags
Sometimes the problem isn’t the code—it’s the trap around it. You become someone else’s exit and only realize it when bids vanish. These are the “I should’ve seen it” tells I respect:
- Thin LP with pinned price: Price grinds up with tiny wicks, but the buy-side depth is paper-thin. One mid-size sell nukes 10–20%. If the 5-minute candle volume collapses while price stays high, that’s a staged exit zone.
- Top holders concentration + fresh fund inflows: If the top 10 hold 60–80% and you see their wallets funding CEXes or wrapping to bridges, you’re probably the exit. I watch whale trackers for this.
- “Anti-bot” excuses for huge slippage: If you need 8–12% slippage to sell because of “bot protection,” that’s a stealth tax or a straight-up trap.
- LP unlock countdowns: A big unlock in hours/days with no clear plan to re-lock? Don’t be the liquidity they pull against.
- Influencer spikes with no structural support: You’ll see the pattern—Twitter Space, TikTok, or Telegram blast, then a wall of sells 15–60 minutes later. If you weren’t in before the post, you’re probably late.
- Admin toggles mid-pump: Owner flips fees higher or changes max transaction/wallet limits as price runs. That’s not “protection,” that’s a shakedown.
I keep a mental note from hard lessons: when price is mooning but market depth is shrinking, the move is already being distributed. “But what if it goes higher?” is the number one line I hear before a 40% slap.
Want the antidote to traps and rugs? It’s not a magic scanner. It’s a repeatable set of risk rules that force you to size correctly, use stops, pre-plan exits, and step aside when conditions are stacked against you. Curious how I structure that so one mistake doesn’t ruin my week?
Next up: I’ll show the exact position sizing, entries, stops, and take-profit ladders I use—plus when I hedge or stay flat. What’s the one rule I refuse to break on new meme coins?
My risk management playbook for meme coins

“It’s not whether you’re right or wrong that matters, but how much you make when you’re right and how much you lose when you’re wrong.” — George Soros
Meme coins are chaos with a ticker. I can’t control the chaos, but I can control my exposure. Here’s the exact structure I use so one mistake doesn’t snowball into a bad week.
Position sizing and bankroll rules
I size from risk, not from conviction. Conviction is a story; risk is math.
- Fixed fractional risk: I risk 0.5%–1% of my total bankroll per trade (the amount I’ll lose if my stop hits). If my account is $10,000 and my stop is 15% away, my position is $100 / 0.15 = $667. That’s it—no “feeling good” overrides.
- Define R: 1R = my per‑trade risk. First target at +1R, scale more at +2R and +3R. If I can’t see at least 2R before obvious resistance, I skip.
- Max daily loss cap: I stop trading for the day if I’m down −3R or −3%—whichever hits first. This single rule has saved me more money than any clever entry.
- Max heat across positions: Total open risk never above 3R. If I’ve got three trades on, they’re each 1R. No stacking five 1R trades on the same theme; correlated memes count as “one big trade.”
- Scale in/out, never all-in/all-out: I start with 50% size, add only if the trade proves me right (breakout + retest on rising volume). I scale out into strength at my ladders. No martingale. Ever.
- Drawdown throttle: After two consecutive losing trades, I cut size by 50%. After three, I’m done for the session. Simple, mechanical, humbling.
Why this works: multiple studies show fixed‑fraction sizing and loss caps reduce “risk of ruin,” even in high-volatility systems. Kelly-style sizing is elegant but too aggressive for meme coins; I use a fractional Kelly approach and cap it. If you’re curious, see the Kelly criterion overview and Van Tharp’s work on position sizing.
Entries, stops, and take-profit ladders
I don’t place stops where it hurts—I place them where I’m wrong.
- Invalidation first, entry second: My stop sits just beyond the last clear swing level, buffered by volatility. I use ~0.8–1.2× the current ATR on the active timeframe as my “noise” buffer. If that makes the stop unreasonably wide, I pass or drop size.
- Pre-set profit ladders: I set targets before entry:
- Take 25% at +1R (or +0.8R if liquidity is thin), move stop to breakeven only after a confirmed higher low.
- Take 35% at +2R, trail the rest with a 1.2–1.5× ATR stop so a parabolic push doesn’t round-trip me.
- Final 40% at +3R or a key HTF level.
- Time stop: If price hasn’t reached +1R within a reasonable window (for me: 6–12 hours on intraday, 2–3 days on swing), I exit. Stale trades bleed attention and fees.
- Example (made simple): Say PEPE is in a compression, ATR(30m) = 8%. I buy after a break-and-retest with a 10% stop (1.25× ATR). With $100 risk, my size is $1,000. I ladder at +10%, +20%, and trail the rest. If it wicks me out, fine—next setup.
On CEXs, I use conditional orders so stops are server-side. On DEXs, I accept that stops aren’t native and manage with alerts and quicker exits—slippage and MEV are part of the game, so I bake wider buffers into my risk.
Fun fact: research on stop-loss overlays in high-volatility assets shows smaller drawdowns and better risk-adjusted returns even when headline win rates drop. You feel fewer “death by a thousand cuts” and avoid the account-killing tails. A readable summary is here: Alpha Architect on stop-losses.
Hedging and staying flat
Sometimes the best move is to dull the blade—or sheath it.
- Perp hedge, spot core: If I hold spot for a narrative but see funding flip extreme and volatility expanding against me, I’ll short perps 30%–100% of my delta. Goal: cut directional exposure, not turn into a cowboy. I unwind the hedge when structure resets.
- Funding matters: If funding is wildly positive and crowded long, I reduce spot rather than “collect” negative carry on a hedge. If funding’s mildly negative and I want to be cautious, a small short hedge can pay to wait.
- Rotate to stables: When liquidity shrinks (weekends, post-news hangovers) or my signals conflict, I step to the side. Cash is a position.
- Stay flat around landmines: I avoid trading through high-impact events without a plan. If I must hold, I size down, widen stops, and accept partial fills.
A quick real-world note: during the PEPE mania, hedging spot with a small short when perp funding ran hot reduced drawdowns meaningfully without killing upside on squeeze days. The job isn’t to be a hero; it’s to be solvent tomorrow.
Personal red lines
- No contract, no coin: If I haven’t run basic contract checks (sellability, taxes, admin keys, LP status), I don’t touch it—even if it’s “printing.”
- No chase after two big green candles: If it’s already vertical on my entry timeframe, I wait for a pullback or I let it go. FOMO is a fee.
- No adding to losers: I can add only if the trade proves me right (higher lows, volume confirmation). If my stop hits, I’m out. Full stop.
- No overleverage: On memes, I cap leverage at 2–3x. Slippage + liquidations = instant regret.
- No blind exposure clusters: Never more than 25% of my bankroll across highly correlated memes. Different tickers, same narrative equals same risk.
- No fatigue trading: If I’m tired, emotional, or revenge-clicking after a loss, I walk. I’d rather miss a runner than fund a meltdown.
I remind myself: entries are optional—exits are mandatory. The scoreboard doesn’t care if I “almost caught the bottom.”
Want to see the exact screens, alerts, and social triggers I use to keep these rules tight without babysitting charts all day? I’m about to show you the simple stack that saves me from FOMO and late exits—ready to peek under the hood?
Tools and resources I actually use to track volatility
Volatility is only scary when it surprises you. I keep a lean setup that pings me before the crowd screams, so I’m reacting to signals—not emotions.
“Clarity beats adrenaline. If I’m waiting for my alerts, I’m not chasing candles.”
I don’t need 20 tabs. I need fast tells. Here’s my practical stack and how I set it up:
- Price and volatility alerts (TradingView + DEX/chain trackers)
- TradingView: On each meme pair that trades on CEX perps, I set:
- Normalized ATR alert: 15m ATR divided by price (ATR/Close) crossing above 1.5% signals expansion.
- Bollinger Bandwidth (BB%) alert: 20-period BB% crossing above 2x its 24h median = “squeeze released.”
- Volume spike alert: 5m volume > 3x 20-bar average to catch genuine attention, not random wicks.
- DEXScreener/BirdEye/GeckoTerminal: For on-chain pairs (Solana, Base, BSC), I favorite the pools with healthy LP and turn on price change alerts at +/− 5% in 15m and +/− 12% in 1h. If an alert fires without a volume spike, I ignore it.
- TradingView: On each meme pair that trades on CEX perps, I set:
- Whale trackers
- Arkham/DeBank: I tag top-10 holders for active tickers and set alerts for transfers > 0.5% of supply or > $50k. One large deposit to a CEX often precedes local tops.
- Etherscan/Solscan watchlists: Free but effective—notify on any movement from the deployer or LP wallet.
- DEXTools Big Swaps/BirdEye Whale: A quick glance shows whether size is buying breakouts or unloading into FOMO.
- Social listening that cuts noise
- X Pro (TweetDeck) columns: Saved searches for “[ticker] listing”, “burn”, “tax removed”, “renounced”, “spaces”, “V2”, and the chain name (e.g., “Solana”). I filter by “Latest” and mute spammy promo accounts.
- LunarCrush/Santiment: I monitor social volume and unique active social authors. A rising author count with flat price often front-runs expansion.
- Exchange accounts: Follow official listing feeds (e.g., Binance Listings, KuCoin). IFTTT or Zapier pushes notifications to my phone for “listing” plus “meme.”
Real-world example: When BONK’s 1h BB% doubled its 30-day median while BirdEye flagged 3x volume and a burst of “listing” mentions on X, the move that followed was clean. The same setup without whale confirmation often turned into a sharp fade. The difference was who was buying.
Volatility dashboards and quick backtests
I keep this simple so I actually use it every day.
- My standard volatility dashboard (one screen):
- Top-left: 15m chart with ATR(14) and BB%; alerts on expansion.
- Top-right: 1h chart with 20/50 EMA and Volume MA; confirms trend and regime shift.
- Bottom-left: DEXScreener trending list for the chain I’m hunting (Solana, Base, BSC) filtered for LP depth > $300k.
- Bottom-right: If perps exist, Coinalyze/CoinGlass for funding flips, open interest jumps, and liquidations heatmap.
- Quick “backtest without the headache” routine:
- On TradingView, load 90 days of data. Turn on Bar Replay.
- Mark every time 15m BB% crosses above 2x its rolling 24h median with volume > 2x average.
- Check what happened in the next 12–24 hours versus when BB% expanded without the volume condition. You’ll see why I insist on volume confirmation.
- Regime check in 10 seconds: If normalized ATR stays elevated for three or more sessions and funding flips positive with rising OI, I expect fast squeezes and use wider stops with pre-set take-profits. If ATR collapses and BB% compresses, I stop pressing momentum and wait.
Note: When a meme is not on perps, skip funding/OI and lean harder on LP depth, top-holder activity, and social author count.
Worth a look: two helpful resources
- EasyEquities’ memecoin volatility analysis — a clean walkthrough that matches what I see: liquidity pockets and social bursts set the stage for outsized moves.
- A Binance Square post on meme coin moves — short, practical, and aligned with the indicators I track. Good for pressure-testing your own checklist.
Building your watchlist workflow
I treat the watchlist like a living organism. It grows when conditions are healthy and shrinks when noise takes over.
- Group by chain and narrative
- ETH memes: PEPE, FLOKI, etc.
- Solana memes: BONK, WIF, new rotations.
- Base/BSC/new chains: high-velocity newcomers with clear LP.
- Micro vs. liquid: separate baskets so you don’t apply the same risk to different beasts.
- Set alert thresholds per group
- Liquid CEX-listed: 15m ATR% > 1.2%, 1h BB% > 1.8x median, 5m volume > 2.5x average.
- On-chain mid-caps: 15m ATR% > 1.8%, LP depth > $500k, whale buys > $25k within 30 min.
- Micros (careful): price alerts only after contract checks; I require top-10 holders < 45% combined and no hidden taxes.
- Daily rhythm (keeps FOMO in a cage)
- Morning: Clear the noise. Remove anything with dead volume or compromised contracts.
- Mid-day: Scan BB% and volume regimes; promote only two tickers to “A-list” for the session.
- Pre-US session: Recheck social author count and exchange feeds. If alerts don’t align, I stand down.
- End of day: Tag outcomes: “Clean expansion,” “Fakeout,” or “No trigger.” This builds your own data fast.
- Rules that save time
- Cap the A‑list at 5 tickers. If a new one enters, another leaves.
- Don’t add a coin without LP depth, top-holder check, and at least one reliable alert configured.
- Once a week, prune anything that hasn’t triggered in 14 days.
Want to see this stack in action on real names like DOGE, SHIB, PEPE, and BONK—what actually triggered the clean moves and what I ignored? Keep going; the next section answers the “okay, but does it work?” question with receipts.
Mini case studies: DOGE, SHIB, PEPE, BONK

I learn the most from watching what actually happened, not what people said would happen. These four names show the patterns that keep repeating in meme coin volatility: celebrity catalysts, deep vs. thin liquidity, token mechanics, and how attention jumps across chains.
DOGE: the power (and risk) of celebrity catalysts
When attention becomes order flow, DOGE is the poster child. Two moments stand out:
- May 2021 “SNL” week: relentless social buzz pushed DOGE into a parabolic run. Funding rates on perps ran hot, open interest ballooned, and the crowd expected a victory lap. The second the catalyst passed, price reversed hard—classic “buy the rumor, sell the event.”
- April 2023 “logo” week: when the Twitter/X logo briefly switched to the DOGE icon, DOGE ripped ~30% in hours. Liquidity was there on top CEXs, but the move still showed how attention shocks create fast squeezes and equally fast givebacks.
What I watched in real time: social spikes first, then perp data confirming froth (funding flips, rising OI without organic spot demand), and finally the unwind when the catalyst faded. Options flow chatter sometimes echoed the move, but the cleanest tell was perp funding + OI stacking into a known event.
Lesson: celebrity mentions accelerate both sides of the trade. If I’m late, I either wait for a clean reset or take smaller, faster trades with pre-set exits. No “hope holds.”
For a quick, data-backed overview of how attention and liquidity push meme volatility, I keep this handy:
EasyEquities’ memecoin volatility analysis and this concise take on catalysts and crowd behavior:
a Binance Square post on meme coin moves.
SHIB: burns, listings, and community coordination
SHIB behaves differently from micro-caps because it sits on deeper liquidity and has a massive holder base. That changes the rhythm of its cycles:
- Listings expanded the runway: as SHIB hit major exchanges in 2021, depth improved and slippage fell. Big candles still happened, but the order book absorbed more size, which smoothed some extremes.
- Burn narrative = attention driver: the community’s burn culture (tracked by services like Shibburn) created periodic “burn waves.” The price effect wasn’t linear—burns are tiny vs. total supply—but coordinated messaging pulled in fresh eyeballs and volume at key moments.
- Shibarium story arc: the L2 launch hype in 2023 drew speculation before release, a wobble on early hiccups, then stabilization as activity and integrations improved. That rumor → confirmation → digestion pattern repeats across SHIB cycles.
Lesson: with SHIB, I respect liquidity and distribution. I track holder concentration and exchange flows: when whales send to CEXs during peak social hype, it’s often distribution, not “strong hands.” Burn headlines can be entries, but I still trade the chart, not the narrative alone.
Again, the best results came from mixing on-chain tells (holder concentration, new wallets) with simple volatility tools, then aligning with event timing—not trading through it blind.
PEPE and BONK: seasonality and chain effects
These two capture “meme season” dynamics on different rails—Ethereum vs. Solana—and how attention migrates.
PEPE (Ethereum): launched into the 2023 meme boom, PEPE showed how fast ERC-20 memes can go when gas prices spike and social volume explodes. The first big pop happened as feeds flooded with screenshots and CEXs listed fast. Later, in August 2023, governance/multisig drama plus large token transfers to exchanges sparked a swift drawdown—proof that contract control optics and treasury moves can nuke sentiment in minutes.
- Read: listings = fuel, but watch centralized token flows; one big wallet moving to CEX is often a countdown timer.
- Volatility tell: RSI and band width went extreme while funding turned euphoric—textbook conditions for a sharp reversion once headlines cooled.
BONK (Solana): BONK’s run into late 2023 matched Solana’s comeback—TVL climbing, fees low, and retail loving fast, cheap transactions. BONK’s early community airdrops bootstrapped holders, and when top exchanges added pairs in December 2023, liquidity deepened and the spotlight intensified. Low fees meant higher velocity: more micro-trades, tighter feedback loops, and “one tweet = one candle” moments across multiple sessions.
- Read: chain mood matters. When the Solana narrative heats up, attention and capital rotate together. You’ll see it in cross-asset correlations and synchronized spikes across SOL ecosystem memes.
- Volatility tell: sudden jumps in active wallets + DEX volume alongside expanding ATR on BONK tended to precede the next burst. When those cooled while perp funding stayed high, risk skewed to the downside.
Lesson: memes don’t pump in isolation. They surf the chain’s momentum. I group watchlists by chain, then track where social and liquidity are concentrating that week. If ETH gas is spiking and SOL activity is cooling (or vice versa), I adjust size and expectations accordingly.
If you want a compact refresher on how those flows look during hype windows, this resource pairing is gold:
EasyEquities’ volatility analysis +
a quick Binance Square breakdown.
Quick answers to common questions
- Are meme coins a good investment or just trades? I treat them as trades. The edge is in timing, sizing, and exits—not 5-year theses.
- Can you predict the next pump? No. But you can spot better risk/reward by watching liquidity depth, social spikes, and funding behavior.
- How do whales and socials affect price? They’re the fuel. Whale CEX inflows during hype often mean distribution; raw social surge without spot demand fades fast.
- How do I avoid rugs? Contract checks (sellability, taxes, admin keys), LP analysis (depth, locks), and skip anything that smells off.
- Should beginners trade meme coins? If you must, use tiny size and hard rules—or paper trade until your process is consistent.
Want a simple yes/no checklist I keep next to my screen—something you can run in 60 seconds before clicking buy? That’s up next. Which two checks would make you instantly pass on a setup? Think about it, then compare it with mine in the next section.
Your meme coin volatility checklist

I keep this list next to my screen. It’s quick, it’s practical, and it stops me from donating coins to the chaos. If a setup fails two or more checks, I pass—no matter how good it “feels.”
Pre‑trade checks
- Liquidity (at your size): Can the pool/exchange absorb your order without wrecking price? I want LP depth at ±2% to be at least 10x my order and total 24h volume to be 50x+. If a $2,000 test order shows >1.5% slippage on an aggregator, it’s too thin.
- DEX vs. CEX flow: If one venue has most of the volume, expect wider spreads and faster wicks. Kaiko’s liquidity work shows memecoin spreads balloon during hype windows—great for entries only if you can get in and out.
- Tokenomics sanity: Any buy/sell taxes? Vesting/unlocks in the next 7–14 days? Is the top‑10 wallet concentration over 60%? I want clear docs, visible LP, and no surprise taxes above 5%.
- Contract checks: Quick honeypot test, trading toggles, and admin permissions. If I can’t confirm I can sell, I don’t buy. Period.
- Socials and attention: Organic chatter > paid shills. I look for genuine discussion, unique commenters, and whale alerts that match on-chain volume. Research in Scientific Reports found feedback loops between social attention and crypto volatility—good fuel, but also fast reversals.
- Volatility state: ATR and Bollinger Band Width. Compression in the lowest 20% of the last 30 days often precedes big moves. Expansion with no structure = skip unless you’re trading momentum with tight risk.
- Catalyst calendar (72 hours): Listings, unlocks, airdrops, influencer events. If a big catalyst is imminent and I’m late, I either scale down or wait for the post‑event shakeout. Think of how fast listing‑day spikes have flipped into intraday reversals on hyped names.
Rule of thumb: If I can’t explain why liquidity, tokenomics, and attention align in three sentences, I don’t touch it.
Ongoing rules while in a trade
- Respect stops and targets: I pre‑set take‑profit ladders (for example: 25% at +15%, 25% at +30%, 25% at +50%, runner) and a hard stop where the setup is invalidated—not where it hurts. No manual widening.
- Trail with structure, not hope: If volatility expands against me (ATR rising while price stalls), I trail at ~1.5x ATR or under the last higher low on the timeframe I entered. If that breaks, I’m out.
- Mind the liquidity clock: If 5‑minute volume collapses 60%+, spreads widen 2–3x, or slippage jumps, I exit first and analyze later. Liquidity is oxygen; when it’s gone, price can gap through your plan.
- Pull risk after chop: Two consecutive losing trades? I cut my size by 50% for the next session. If I hit my daily max loss, I’m done. Chasing “one more” is how accounts bleed.
- Hedge or flatten into events: If I’m holding through a known catalyst, I reduce size or hedge with perps. No hero trades through blind risk.
Optional: when to step away
- Boredom trades: If I’m scanning for a reason to press buy, I close the chart.
- Influencer inertia: If my thesis is “X tweeted,” I pass unless on-chain and volume confirm.
- Rule drift: If I catch myself moving stops “just this once,” I stop for the day.
- Emotional tilt: After a big win or loss, I reset. Screens off, alerts on.
Quick examples of the checklist at work
- Thin pool, big crowd: A fresh ticker trends on X. DEX shows $300k depth inside 2% and 24h volume of $2m. My intended $5k entry would eat 3% slippage—hard pass. Twenty minutes later, it spikes 25% then nukes 35% on one whale exit. The pass saved me from being the exit.
- Compression setup: A mid‑cap meme sits in 10‑day BB Width lows with steady on‑chain wallet growth and no near‑term unlocks. ATR is basing. I scale in small, set a tight invalidation, and let the first expansion pay the risk. If volume doesn’t confirm, I scratch quickly.
- Event avoidance: A listing rumor trends, but I’m late. I wait. After the announcement, price spikes and reverses within an hour—classic liquidity event. I look for the higher low after the flush instead of gambling through it.
Final thoughts and next steps
Meme coin volatility isn’t random. It’s social energy slamming into thin markets, amplified by tokenomics and liquidity gaps. When I measure risk, track the right signals, and keep my sizing honest, I don’t catch every moonshot—but I skip most landmines.
Steal this checklist, tweak it to your rhythm, and keep it where you can’t ignore it. Bookmark this on https://cryptolinks.com/, share it with a friend who keeps getting whipsawed, and build your own rules on top of mine.
Stay curious, stay humble, protect the bankroll.